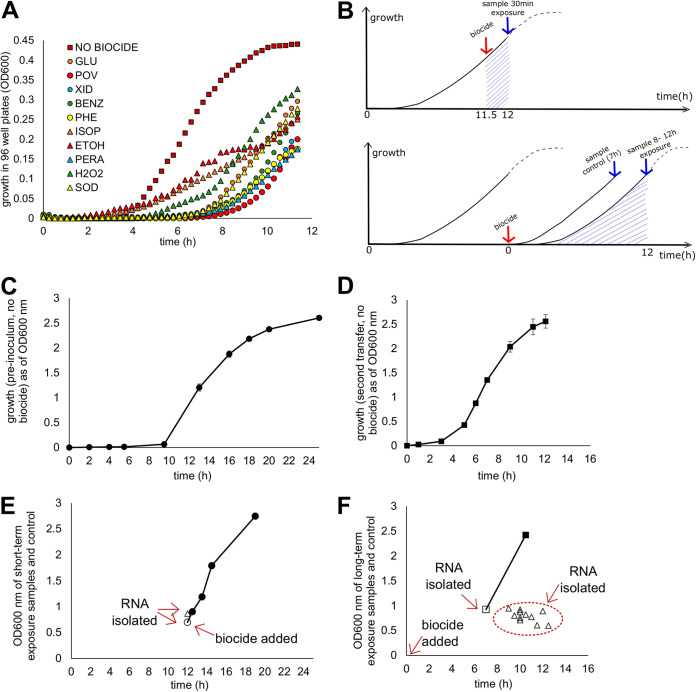
FIG 2.
Growth and sample collection protocol. (A) The growth curves for E. coli MG1655 in 96-well plates with and without the presence of each biocide at the concentration picked for transcriptomics assays. (B) Growth and sample collection protocol for samples exposed to biocide for the short (top) and long (bottom) term. (C) Typical growth of E. coli MG1655 in assay tubes without biocide, starting from a frozen culture. (D) Typical growth of E. coli MG1655 in assay tubes without biocide, starting from dilution of the preinoculum depicted in panel C. (E) Actual OD600 values for samples with a short-term exposure and the control at the time of collection (open circle, control; open triangle, samples with biocide exposure). Closed circles represent the trajectory of growth of the control after sample collection. (F) Actual OD600 values for samples with long-term exposure and the control at the time of collection (open square, control; open triangles, samples with biocide exposure). The closed square represents the trajectory of growth of the control after sample collection.

