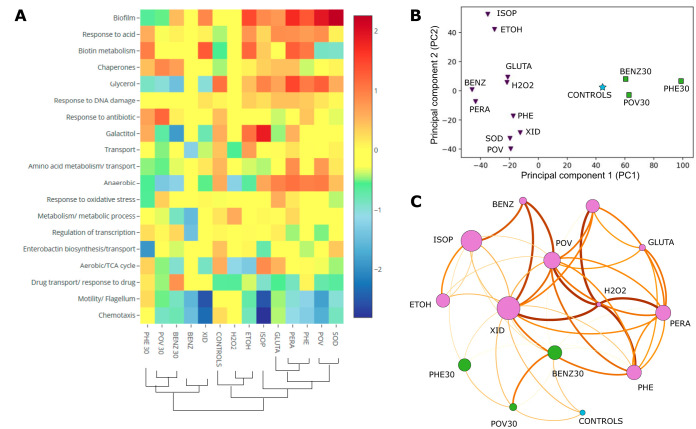
FIG 3.
Transcriptomic response of E. coli to 10 commonly used biocides. (A) DEGs (q < 0.05) from RNA-seq were organized into clusters based on GO biological process terms. The average between the log2 fold change in expression of DEGs belonging to the same category was calculated, and the biological processes were organized in descending order of differential regulation. (B) Principal-component analysis (PCA) for the DEGs identified (triplicates). Squares and triangles correspond to the samples with short- and long-term exposures, respectively. The star represents the result for the comparison between the two sets of controls. (C) Network connections between the biocide conditions. The node size depends on the number of DEGs for the specified biocide condition, and the connections between nodes (edges) are based on shared DEGs. A higher edge thickness indicates a higher number of shared DEGs compared to the total number of DEGs for the condition. Only the top three connections per condition are shown. BENZ, benzalkonium chloride; BENZ30, benzalkonium chloride exposure for 30 min; ETOH, ethanol; GLUTA, glutaraldehyde; H2O2, hydrogen peroxide; ISOP, isopropanol; PERA, peracetic acid; PHE, chlorophene; PHE30, chlorophene exposure for 30 min; POV, povidone-iodine; POV30, povidone-iodine exposure for 30 min; SOD, sodium hypochlorite; XID, chlorhexidine.

