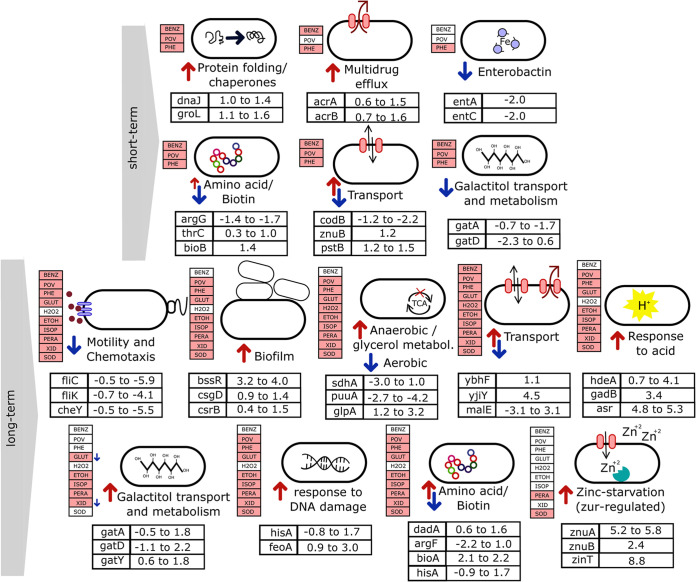
FIG 4.
E. coli responses to short- and long-term biocide exposure. Upregulated processes (red arrows) and downregulated processes (blue arrows) after subinhibitory short-term (3 biocides) or long-term (10 biocides) biocide exposure. Biocides were colored when the biological process was affected (at least one DEG belonged to that category) after exposure to the biocide. Representative DEGs for each biological process are shown along with their log2 fold change in expression over all biocides. Detailed information with the complete list of DEGs can be found in Table S1 in the supplemental material. metabol., metabolism.

