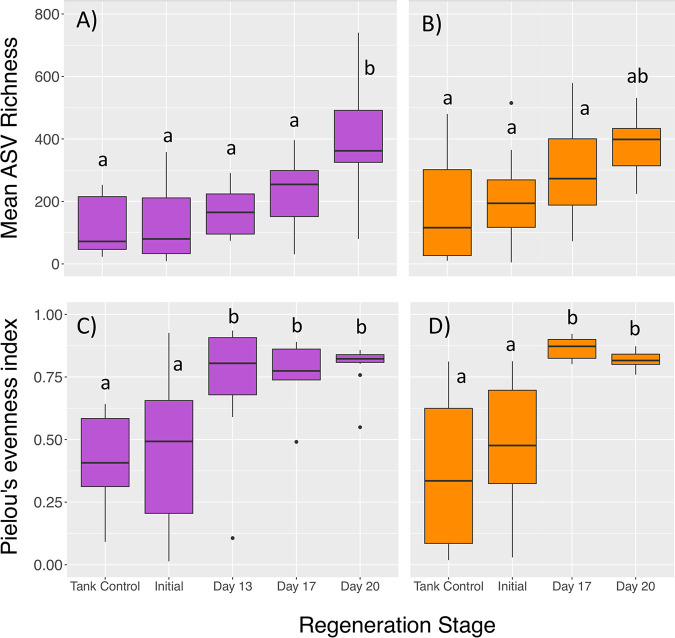
FIG 7.
Alpha diversity indices, including mean ASV richness for intestine (purple) (A) and stomach (orange) (B) microbial communities and mean Pielou’s evenness for intestine (purple) (C) and stomach (orange) (D) microbial communities over regeneration time. Different letters indicate significant differences in diversity indices with regeneration time (ANOVA pairwise comparisons, P < 0.05).

