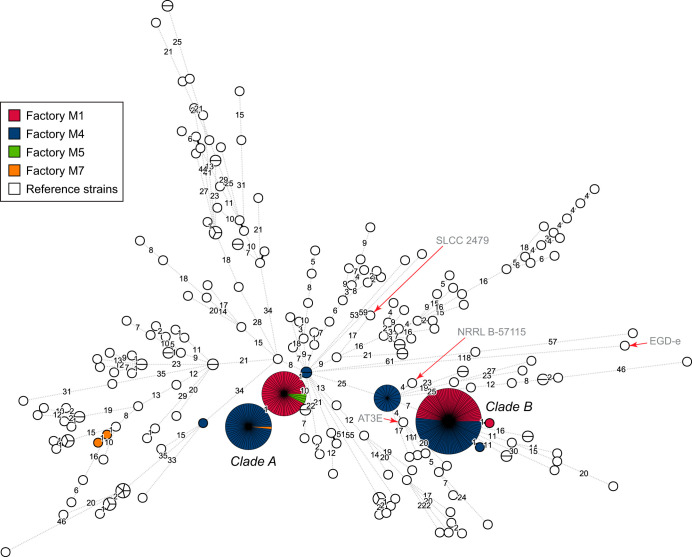
FIG 1.
Minimum spanning tree based on cgMLST allelic profiles, showing the relationship between the 252 isolates from the Norwegian meat processing industry, colored according to the factory where they were isolated, and 202 CC9 reference genomes obtained from public databases (white nodes). The area of each circle is proportional to the number of isolates represented, and the number of allelic differences between isolates is indicated on the edges connecting two nodes. Labels clade A and clade B refer to the two main clusters of isolates from the Norwegian meat processing industry described in the text. Selected reference strains are indicated with red arrows.

