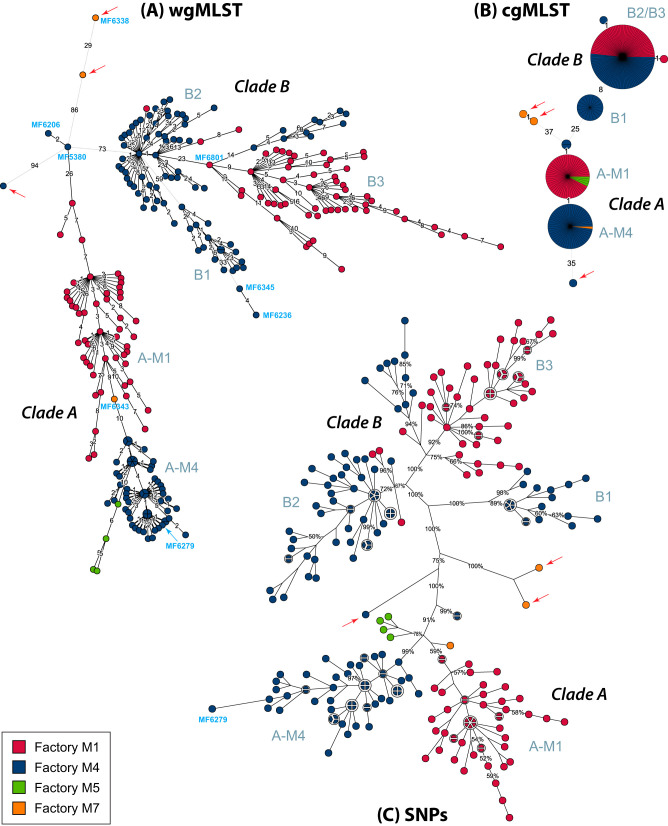
FIG 2.
Phylogenetic trees for ST9 isolates from Norwegian meat processing industry. Shown are minimum spanning trees based on wgMLST (A) and cgMLST (B) analyses and a maximum parsimony tree based on an alignment of the 554 SNP positions detected using SLCC 2479 as the reference genome, showing the tree with the highest resampling support (C). Red arrows point to outliers. The area of each circle is proportional to the number of isolates represented, and the factory of origin for each isolate is indicated by the color. In panels A and B, branch labels indicate the numbers of target genes with differing alleles. In panel C, branch labels represent bootstrap resampling support values, showing only values of >50%. Branch lengths were scaled using logarithmic (A) and square root (B and C) scaling. Labels next to selected clusters refer to the subclusters described in the text. Selected isolate names are indicated in blue.

