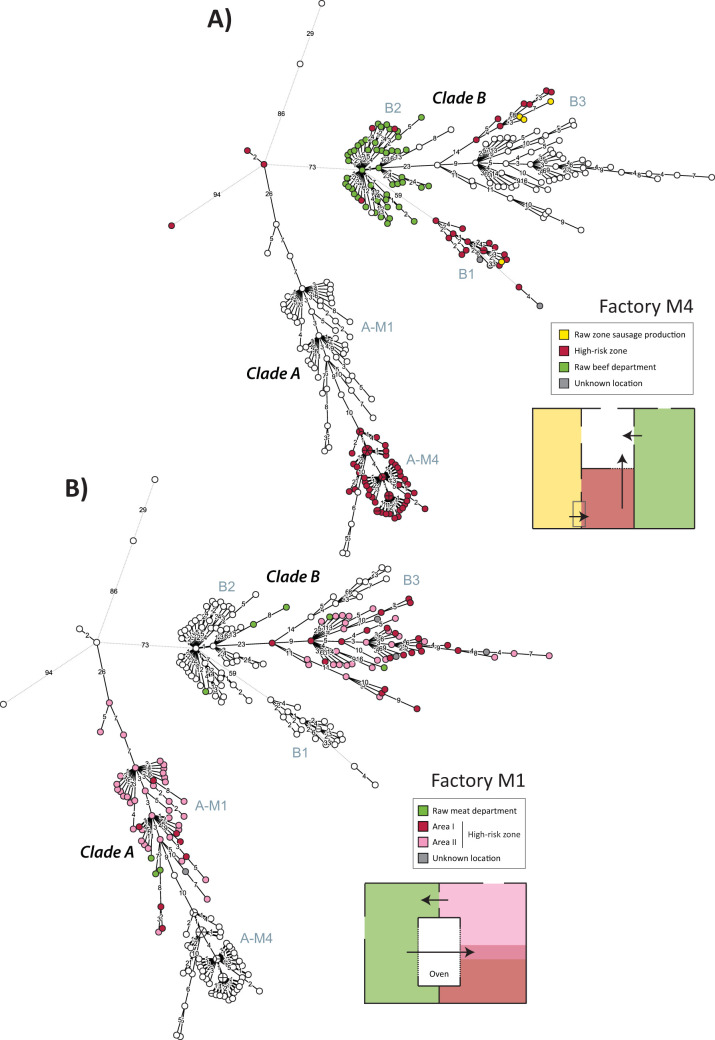
FIG 4.
Minimum spanning trees based on wgMLST alleles, colored according to the location within factory M4 (A) and factory M1 (B) at which each L. monocytogenes isolate was obtained. Insets show sketches of the factory layouts, with arrows indicating the direction of movement of products and equipment through processing.

