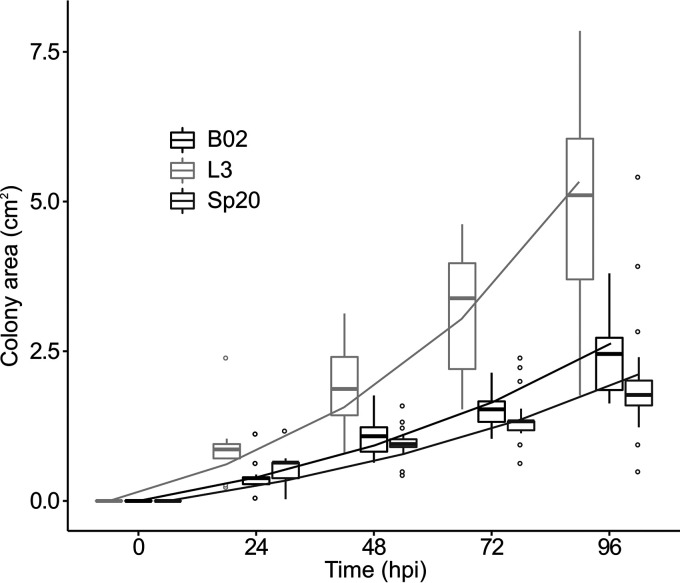
FIG 2.
Boxplot of surface spreading of B02, L3, and Sp20 on semisolid modified MM (MMS). Boxes represent the 1st to 3rd interquartile ranges. The lines within the boxes indicate the median, the whiskers represent quartiles ± 1.5× interquartile distance, and the circles indicate outliers. Lines represent the predicted values of the LMM. Values for L3 differed significantly from those for the other strains (LMM: Tukey’s test, P < 0.050).

