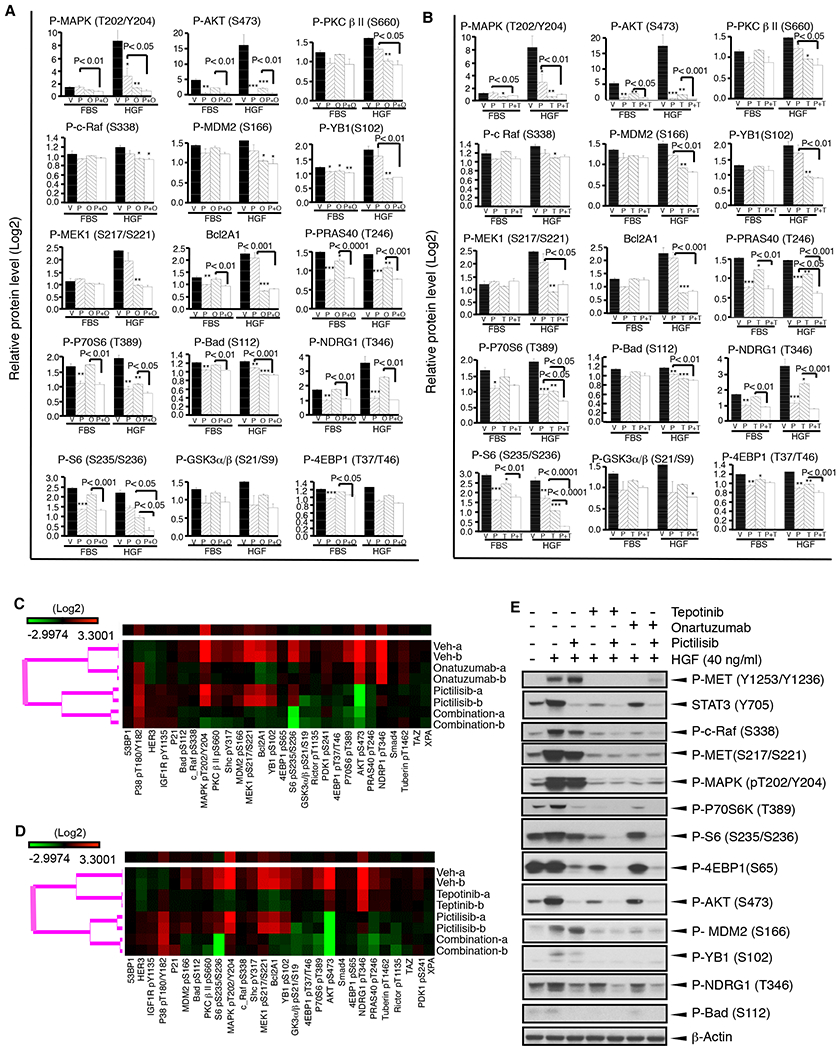
Figure 6. Cellular signaling response to targeting of MET and/or PIK3CA in an environment with or without HGF.

PIK3CA-H1047R/MET-T1010I-expressing MCF-10A–derived cells were starved overnight followed by treatment with or without drugs for 6 hours and then were stimulated with HGF (40 ng/ml) or 10% FBS for 30 minutes. Cell lysates were subject to RPPA as described in Materials and Methods (mean ± standard deviation; P value based on the log2 data). A. Cells were treated with pictilisib (P) or onartuzumab (O) alone or their combination (P+O) before stimulation with HGF or FBS. B. Cells were treated with pictilisib (P) or tepotinib (T) alone or their combination (P+T) before stimulation with HGF or FBS. C. Cells were treated with pictilisib and/or onartuzumab followed by stimulation with HGF. Data are presented in a matrix format: each row represents a sample and each column an antibody target. There are four sub-clusters as indicated from top to bottom: vehicle, onartuzumab, pictilisib, and their combination. Red represents high and green represents low activation. D. Using tepotinib instead of onartuzumab. E. A portion of the RPPA data was validated by Western blot.
