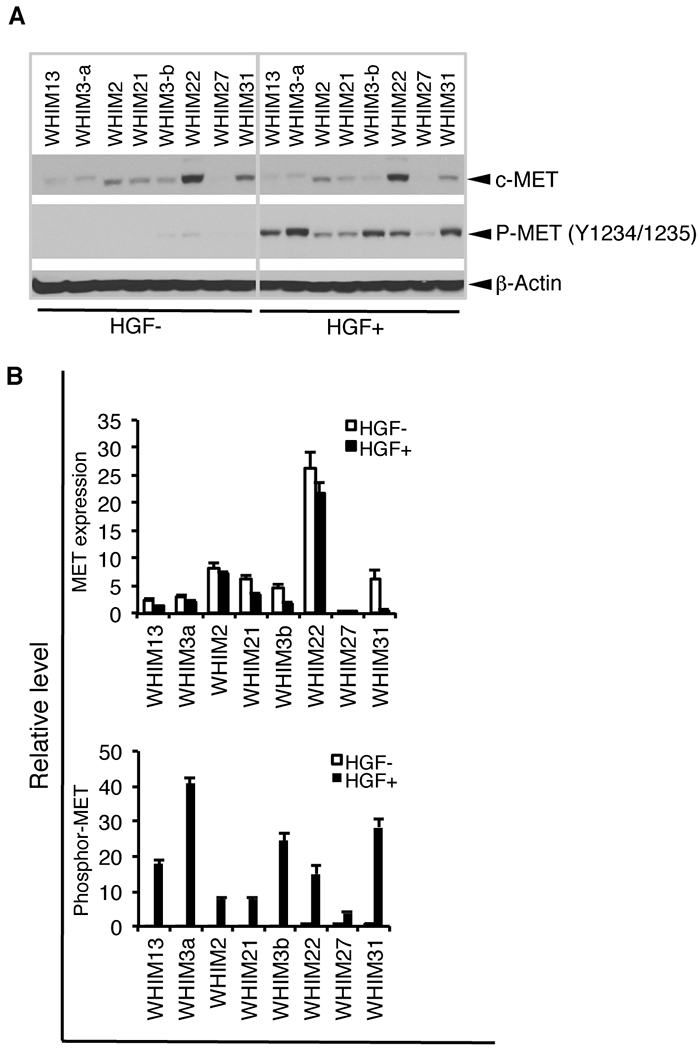
Figure 7. Characterization of HGF/MET axis in patients-derived xenografts.

A. MET protein expression and activation by stimulation with HGF in PDXs. The cell lines from the PDX received starvation for over night by withdrawing serum and all growth factors, including insulin, EGF, and hydrocortisone, followed by stimulation with or without HGF (40 ng/ml) for 20 minutes. Cell lysis was collected and assessed expression and phosphorylation of MET with Western blotting. B. Quantitative densitometric analysis of the density was performed with AlphaView SA software.
