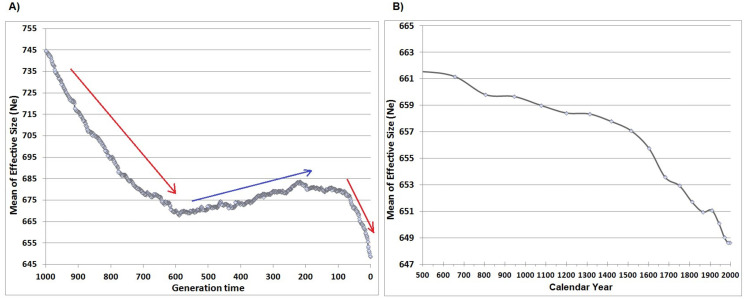
Figure 4. Harbour seal’s effective size (harmonic mean of the posterior distribution, VarEff analysis) within Moray Firth (using 17 microsatellites) in generation time (from 0 to 1,000 generations ago) (A) and in calendar years (from 1995 (sampling date) to 500 AD.
The arrows represent the main trends: reduction (red) and increase (blue). (B) shows the latest tendency enlarged, the last red arrow.

