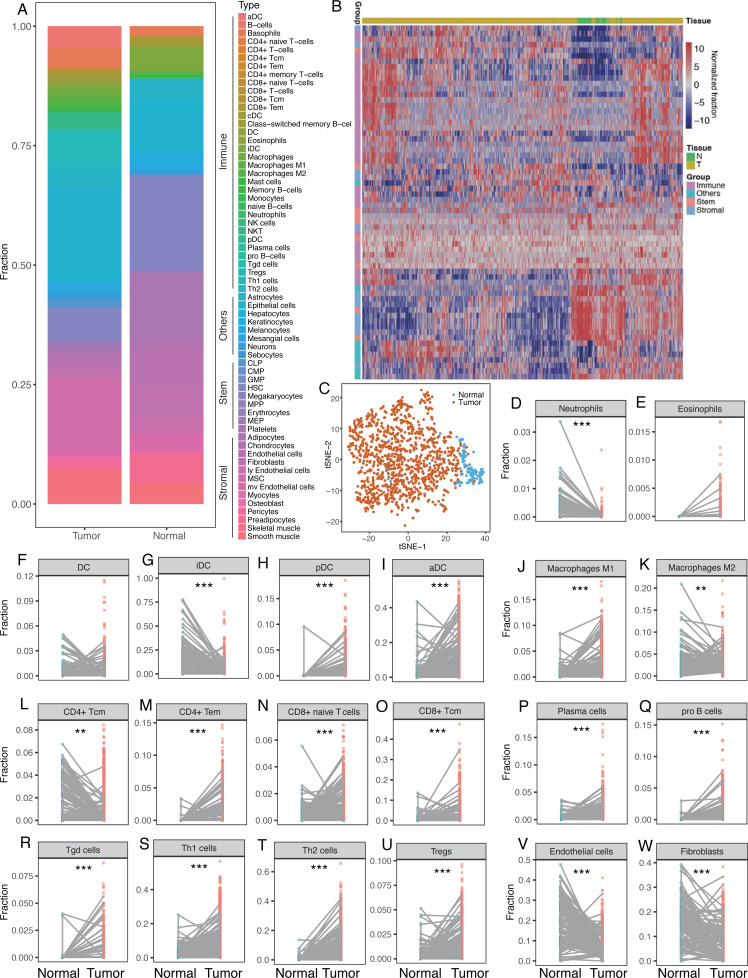
Figure 1. Differences of cellular heterogeneity between breast tumor tissue and normal tissues.
(A) Median fractions of Sixty-four cell types in breast tumor and normal tissues. Sixty-four cell types were grouped into four groups: immune, stem, stromal, and other cells. (B) Heatmap of fractions of 64 cell types in 1,092 breast tumor tissues and 112 adjacent normal tissues. (C) Dimensionality reduction and visualization by t-Distributed Stochastic Neighbor Embedding (t-SNE) clustering based on cell fractions. (D) to W. Dot plots of fractions of certain cell types in breast tumor and normal tissues. Lines between dots indicated paired tissues from the same breast cancer patient. *, P < 0.05. **, P < 0.01. ***, P < 0.001.

