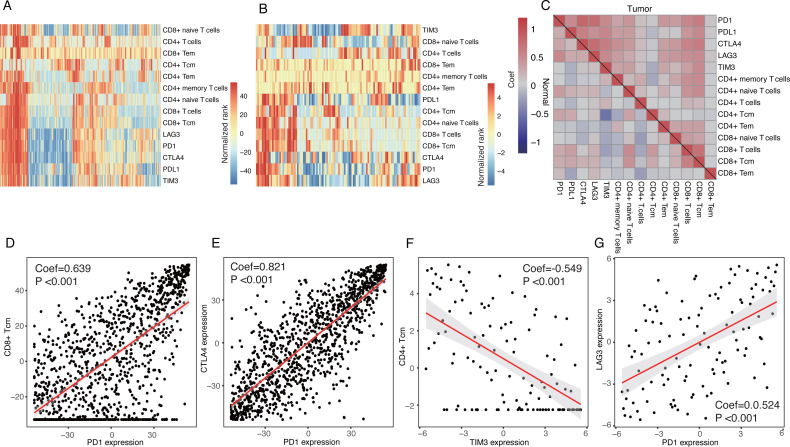
Figure 2. Expression patterns of inhibitory receptors on CD4+/CD8+ T cells.
(A and B) Heatmaps of expression of inhibitory receptors including PD1, CTLA4, LAG3 and TIM3, and fractions of CD4+/CD8+ T cells in tumor tissues (A) and normal tissues (B). Data were transformed by rank and normalized. (C) Clustered correlation matrixes among inhibitory receptors and CD4+/CD8+ T cells in tumor tissues (up-right triangle) and normal tissues (low-left triangle). (D) Dot plot of correlations between PD1 expression and fractions of CD8+ Tcm in tumor tissues. (E) Dot plot of correlations between PD1 expression and CTLA4 expression in tumor tissues. (F) Dot plot of correlations between TIM3 expression and fractions of CD4+ Tcm in normal tissues. (G) Dot plot of correlations between PD1 expression and LAG3 in normal tissues.

