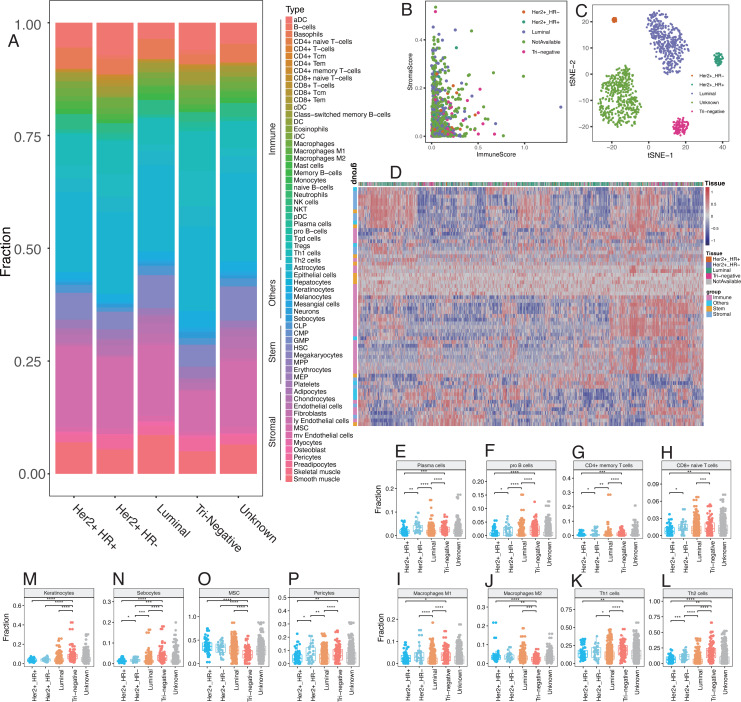
Figure 6. Differences of cellular heterogeneity among different subtypes of breast cancer.
(A) Median fraction of 64 cell types in five subtypes of breast tumor. (B) Cluster analysis by ImmuneScore and StromaScore, which were calculated by summing up the fractions of immune and stromal cells, respectively. (C) Dimensionality reduction and visualization by t-Distributed Stochastic Neighbor Embedding (t-SNE) clustering with fractions of all the 64 cell types. (D) Heatmap of fractions of 64 cell types in five subtypes of breast cancer. (E to P) Box plots with dots of fractions of certain cell types in five subtypes of breast cancer. *, P < 0.05. **, P < 0.01. ***, P < 0.001, ****, P < 0.0001.

