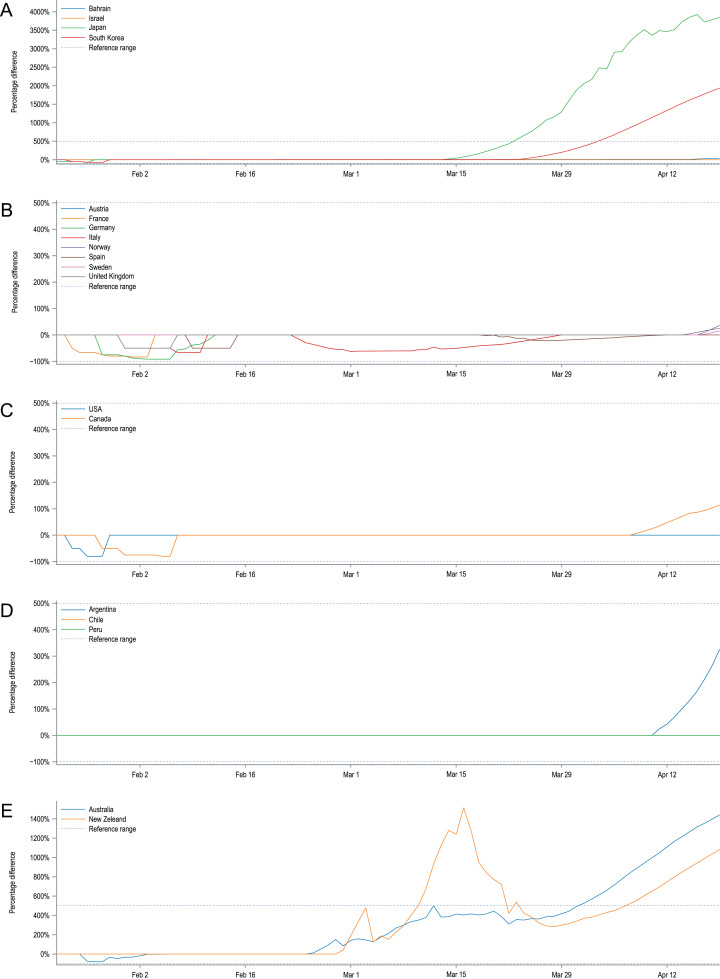
Figure 2. Percentage difference over time between the number of reported cases and confidence intervals’ limits for modelled predictions.
Positive values state that the model overestimates the number of diagnosed cases, negative values indicate the underestimations of the model. Observed numbers of cases that are within the model CIs are equal to 0. For clarity, country plots were grouped by continents and presented in five plots: (A) Asia, (B) Europe, (C) North America, (D) South America, (E) Australia and Oceania. The large discrepancies for Japan, Australia, New Zealand and the Republic of Korea are putatively caused by the fast and pronounced reaction of their governments and early introduced NDIs which are not reflected in our model.

