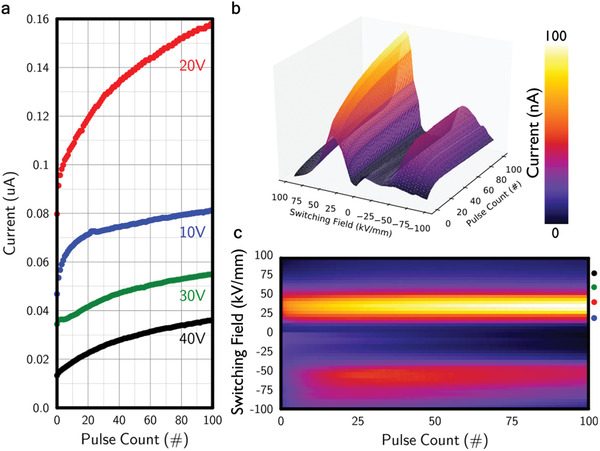
Figure 5.

a) A plot of current measured under a 5 V steady‐state potential difference (10 kV mm−1 field) against the number of 10 ms pulses applied, with the voltages of these pulses as labeled. The domain state was reset before each set of measurements made with a given pulse voltage magnitude. b) A 3D plot showing steady‐state currents as a function of the cumulative number of pulses applied, for different pulse voltage magnitudes. The double peak features that emerge mirror those in Figure 3c, but here the plasticity effects are clearly evident. c) Shows (b) from a bird's‐eye view. Colored dots indicate the switching pulse fields associated with data in (a).
