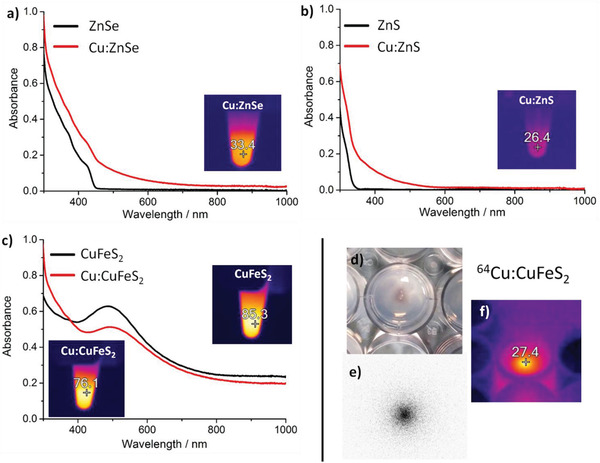
Figure 4.

a) Absorption spectra of ZnSe and Cu:ZnSe NCs,b) ZnS and Cu:ZnS NCs and c) CuFeS2 and Cu:CuFeS2, before (black line) and after (red line) undergoing a 13% Cu exchange; the inset panel is a IR image of the Cu:NCs after 3 min of continuous exposure to an 808 nm laser at 2 W cm−2. A digital picture (panel d) and the radioluminography (panel e) of a tiny drop (35 µL) of 64Cu:CuFeS2 NCs (exchanged at 0.2%) loaded on agarose gel (0.5% in PBS 1X). Also, the IR image taken after 20 min of exposure to an 800 nm laser at 2 W cm−2 is shown (f).
