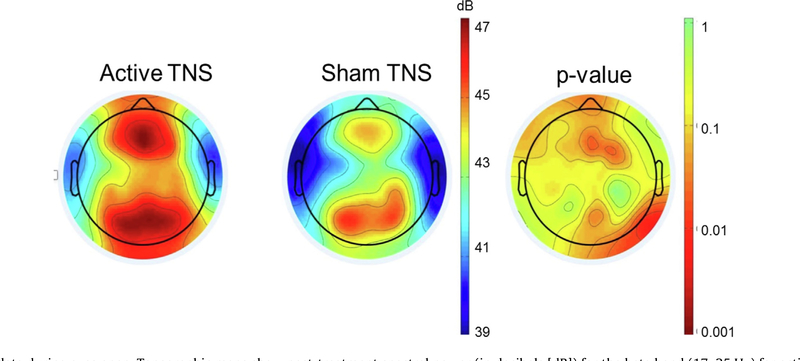
Fig. 1.
Resting EEG data during eyes open. Topographic maps show post-treatment spectral power (in decibels [dB]) for the beta band (17–25 Hz) for active (left) and sham (middle) groups, as well as a p-value plot (right). A direct stimulating effect would likely affect the resting EEG profile in bilateral prefrontal regions, closer to where stimulation occurred.

