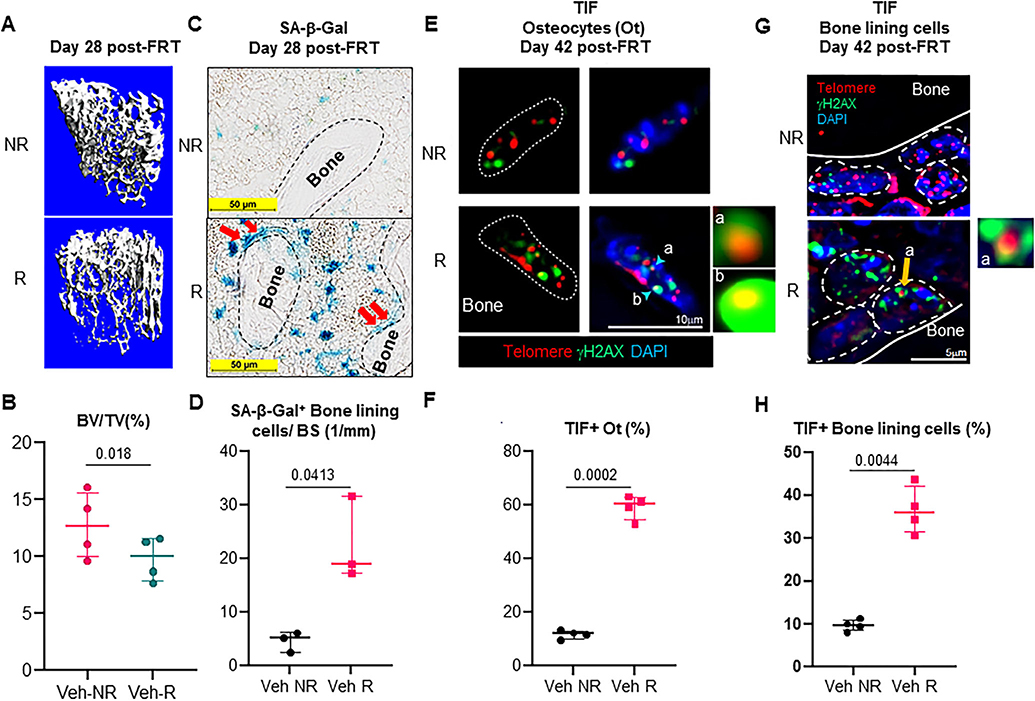
Fig. 1.
Identification of senescent osteoblasts and osteocytes in radiated bones. (A,B) The right legs of C57BL/6 mice were radiated (24 Gy) in a 5-mm region near the femoral metaphysis, while the left leg served as control. R and NR femurs at 28 days post-FRT were harvested, μCT scanned (n = 4 animals), fixed, decalcified, and processed for frozen sectioning. Representative 3D-reconstructed images are shown in A; BV/TV is shown in B. (C) SA-β-gal staining shows the presence of senescent osteoblasts (red arrows) in frozen femur sections (n = 3 animals) at 28 days post-FRT. (D) Quantification of SA-β-gal+ cells lining the bone surface. (E) R and NR femurs (n = 4 animals) at 42 days post-FRT were harvested and processed for MMA embedding. Five-micrometer (5-μm) deplasticized sections were processed for TIF staining and TIFs were detected. Telomeres (red) and γH2AX (green) are shown in Ot of nondecalcified NR and R femurs, 42 days post-FRT. The co-localization detects yellow-orange TIF foci. Insets “a” and “b” show images representative of TIF+ (R) osteocyte nuclei. (F) Quantification of TIF+ osteocytes from NR and R femurs. (G) Detection of TIF+ bone lining cells including osteoblasts in nondecalcified NR and R femurs, 42 days post-FRT. Inset “a” shows a representative image of a TIF from an osteoblast. (H) Quantification of TIF+ bone lining cells on the trabecular bone surface in NR and R femurs. Statistical analysis was done using GraphPad Prism and p value was calculated using a two-tailed paired t test to compare the R and NR bones from the same animals. BV/TV = bone volume fraction of the total volume; Ot = osteocytes.

