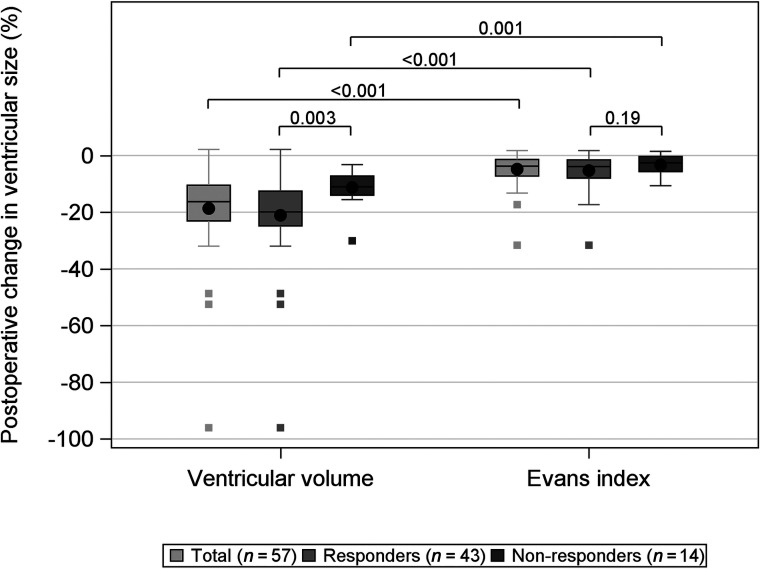
FIG 1.
Box-and-whisker plot showing the change in ventricular size measured by VV and the EI after shunt treatment in 57 patients with iNPH. The whiskers denote values within the 1.5 interquartile range from the first and third quartiles, and the boxes represent outliers. The P values for the difference between responders (gray) and nonresponders (dark gray) are presented as well as the total (light gray). VV decreased significantly more than the EI for all groups. Responders had a significantly larger VV decrease than nonresponders. There was no difference in the EI between responders and nonresponders.

