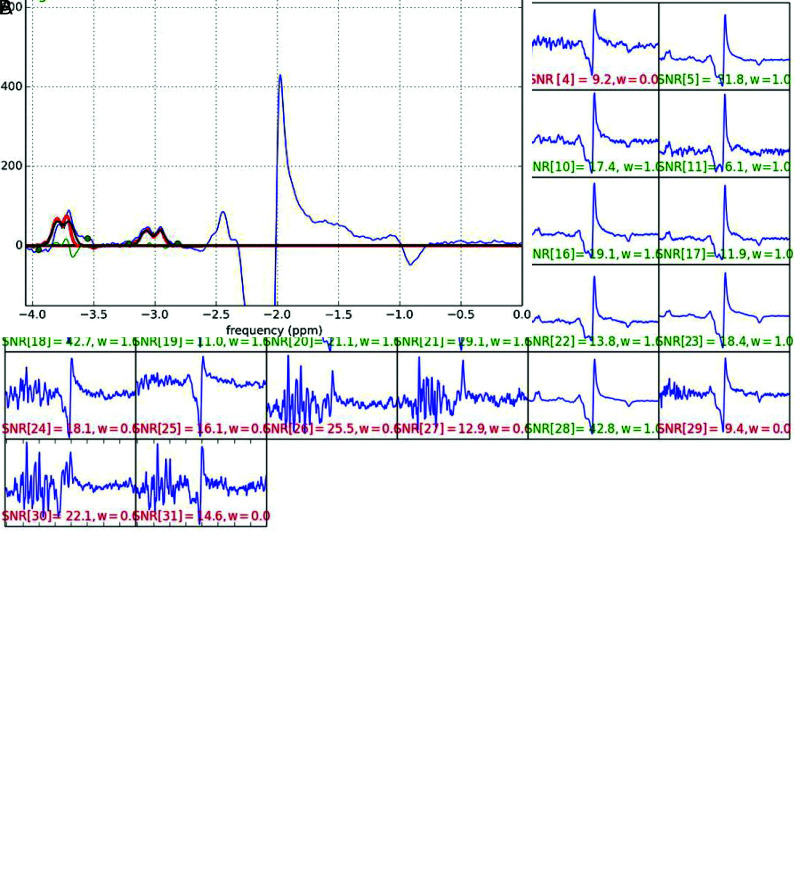
FIG 2.
Acquisition and spectral fitting of MEGA-PRESS MR spectroscopy. A, MR imaging data are acquired with a 3T MR imaging scanner with a 32-channel phased array head coil. The signal-to-noise ratio acquired on each channel is visually checked, and raw data with a low signal-to-noise ratio (red characters) are removed from averaging. B, Selected raw data are averaged in the time domain and baseline-corrected, and the areas under the GABA and Glx peaks at 3.01 and 3.8 ppm (red lines) are measured by fitting to double and single Gaussian functions, respectively.

