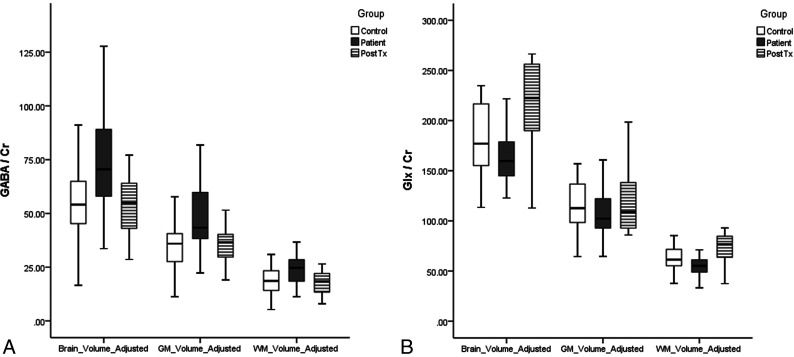
FIG 3.
The boxplots of GABA/Cr (A) and Glx to Glx/Cr (B) in healthy controls and Internet and smartphone addicted subjects pre- and posttherapy. The horizontal line is the median, and the upper and lower ends of the boxes are the upper and lower quartiles, respectively. The vertical lines represent data ranges. PostTX indicates postcognitive behavioral therapy.

