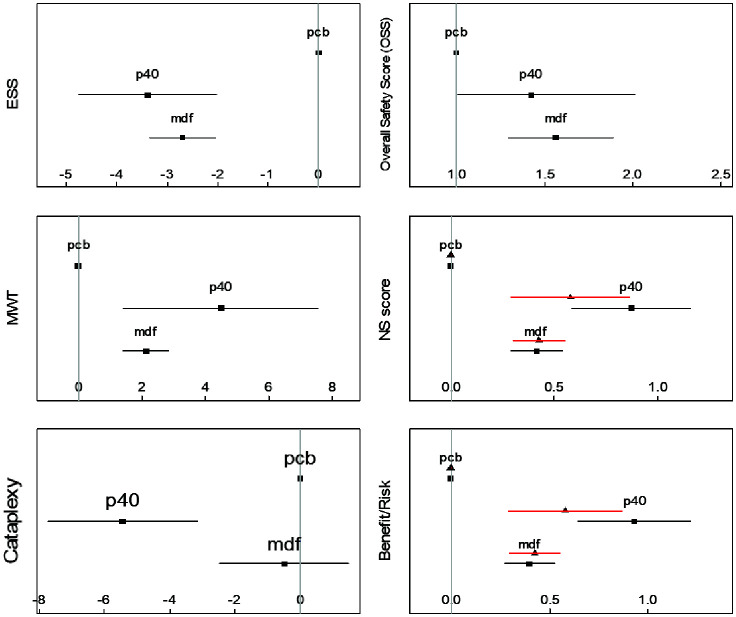
Figure 3.
Forest plot for all the compared endpoints.
Measures: ESS (mean change from baseline in ESS scores), MWT (mean change from baseline in minutes), Cataplexy (mean change from baseline in weekly rate of cataplexies), Overall Safety Score (relative risk, defined as the ratio between the number of treatment emergent adverse events, nTEAEs, on the considered drug on nTEAE on the placebo arm). For the NS scores and risk benefits sub-graphics, black squares represent NS1 score and corresponding benefit/risk adapted for narcolepsy type 1 patients, whereas black triangles represent similar values for NS2 and corresponding benefit/risk for narcolepsy type 2 patients.
ESS, Epworth Sleepiness Scale; MWT, Maintenance of Wakefulness Test; mdf, modafinil up to 400 mg; pcb, placebo; p40, pitolisant up to 40 mg

