Figure 2.

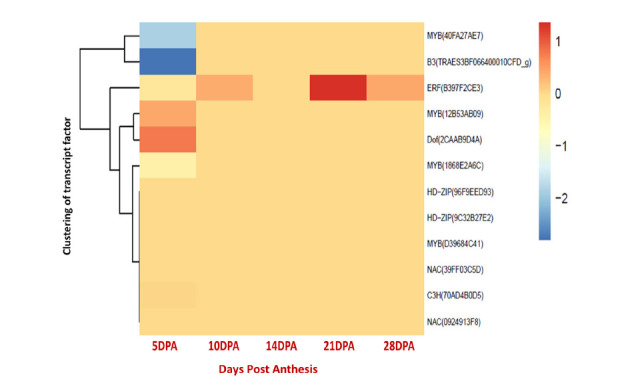
Fold changes expression of TFs from 5 DPA to 28 DPA. Values are expressed as log2fold change (fpkm+1). Red or blue colors indicate the differentially up or down regulated TF genes, respectively.

Fold changes expression of TFs from 5 DPA to 28 DPA. Values are expressed as log2fold change (fpkm+1). Red or blue colors indicate the differentially up or down regulated TF genes, respectively.