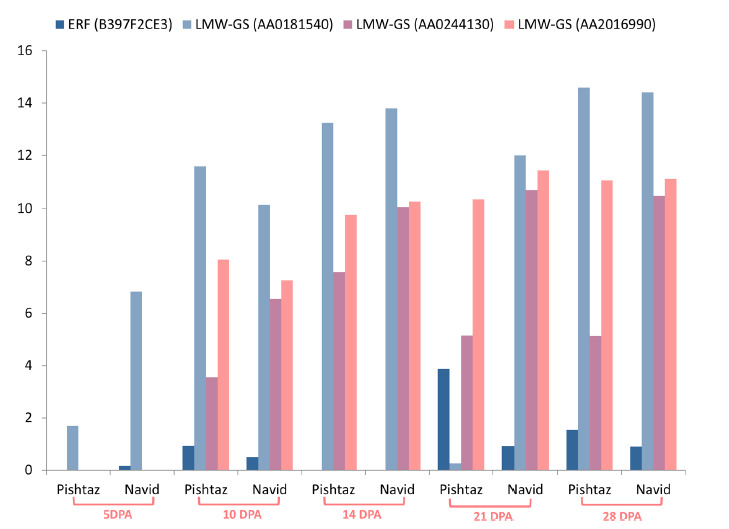
Figure 4.

Expression pattern of ERF transcription factor gene (B397F2CE3) and differentially expressed LMW-GS genes during grain filling in Pishtaz and Navid cultivars. The vertical axis represents the LMW-GS and ERF gene expression values during 5, 10, 14, 21 and 28 DPA in two wheat cultivars. Values are expressed as gene expression (fpkm).
