
Figure 2.
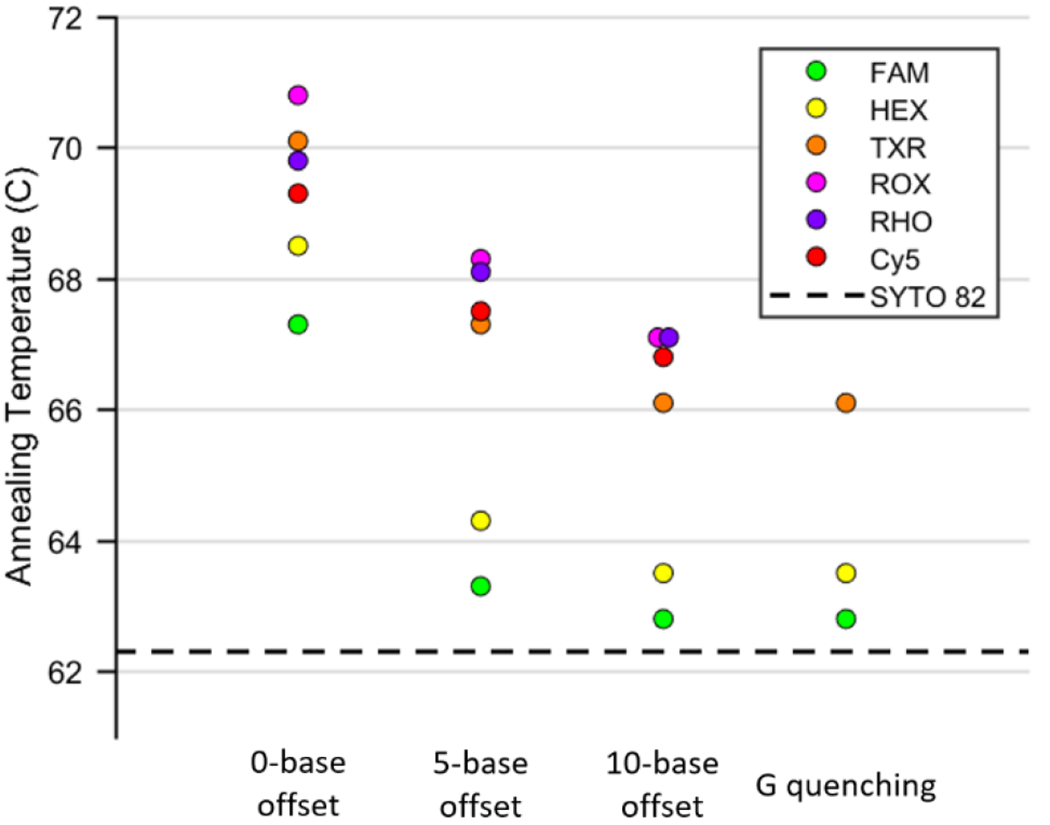
Plot of annealing temperatures for each fluorophore quenched by BHQ2 with 0, 5, and 10-base offsets, as well as quenched by guanine with no offset. The horizontal dashed line represents the annealing temperature of unmodified DNA measured with SYTO 82 intercalating dye.