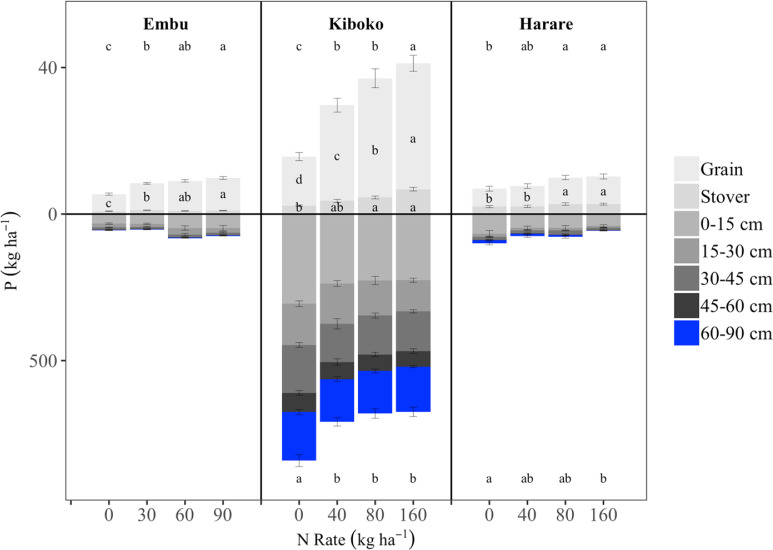
Fig. 3.
Phosphorus (P) plant-soil balance, averaged across all hybrids, in response to long-term N rates applied to continuous maize at Embu, Kiboko, and Harare. Letters denote differences among the hybrids’ total plant (above bars), grain/stover (on respective parts of bars), or total soil contents (below bars) (p ≤ 0.05). Where there are no letters, the difference was not significant

