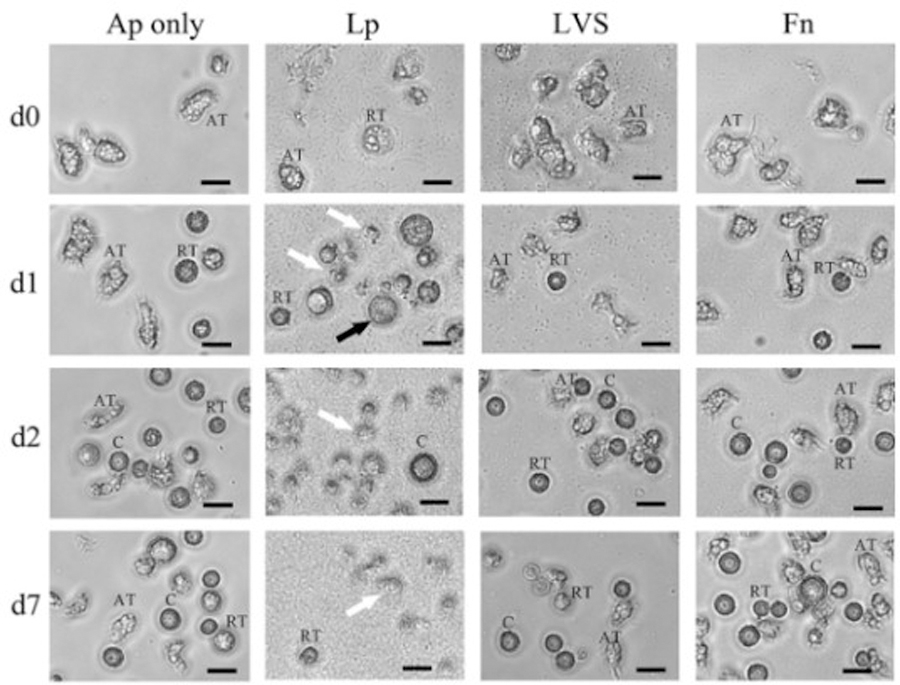
Figure 6.

Phase contrast microscopic images illustrating the differences in the cytopathic effects of Lp, LVS, and Fn on A. polyphaga cells. Amoebae were infected with an MOI of 100 with Lp, LVS, or Fn cells and incubated at 30 °C. Images were taken at each time point (days 0, 1, 2, and 7) and are representative of two independent experiments with three replicates each (n = 6). Black scale bars represent 20 μm in length. AT, amorphous trophozoite; RT, rounded trophozoite; C, cyst. The black arrow indicates an infected cell. White arrows show lysed amoebae
