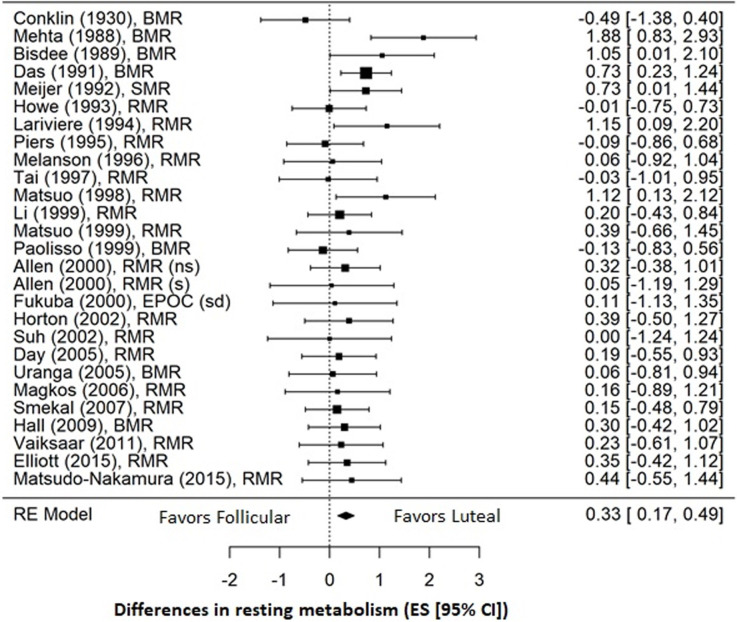
Fig 3. Forest plot of effect sizes for all 26 studies included in the meta-analysis.
Studies are listed by first author and year of publication. The overall effect (ES = 0.33) was calculated using a random effects (RE) model and favors an increase in RMR during the luteal phase compared to the follicular phase. (ns) = non-smokers; (s) = smokers; (sd) = standard diet.

