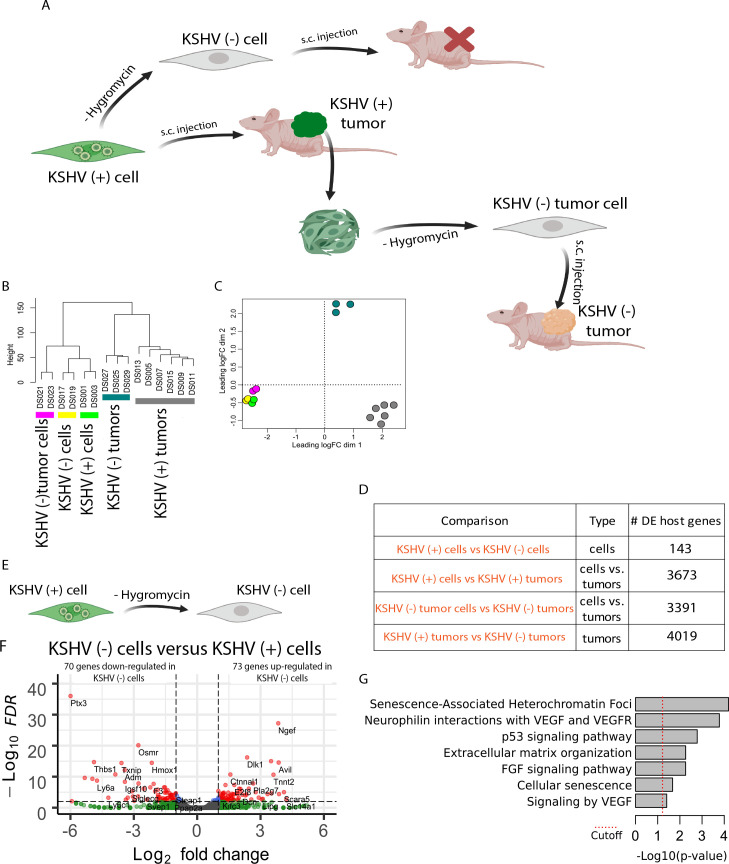
Fig 1. Genome-wide analysis of host transcripts by RNA deep sequencing.
(A) Schematic representation of the animal Model of Multistep KS Carcinogenesis. (B) Unsupervised hierarchical clustering of the host transcriptome. (C) Multidimensional scaling plot of the host transcriptome showing the distance of each sample from each other determined by their leading logFC. The leading logFC is a distance metric that represents the average (root mean square) of the largest absolute logFC between each pair of samples. (D) Number of differential expressed genes (DEGs) in key biological comparisons that were detected by RNA-sequencing analysis of: two KSHV (+) cells, two KSHV (-) cells, six KSHV (+) tumors, two KSHV (-) tumor cells and three KSHV (-) tumors. (E) Schematic representation of the comparison between KSHV (+) cell and KSHV (-) cell. (F) Volcano plot showing 144 differentially expressed genes (DEGs) analyzed by RNA-Sequencing between KSHV (-) cells and KSHV (+) cells in vitro. 70 genes were down-regulated and 73 gees were up-regulated in KSHV (-) cells. (G) Functional enrichment analysis based on the 144 genes differentially expressed among KSHV (-) cells and KSHV (+) cells in vitro.

