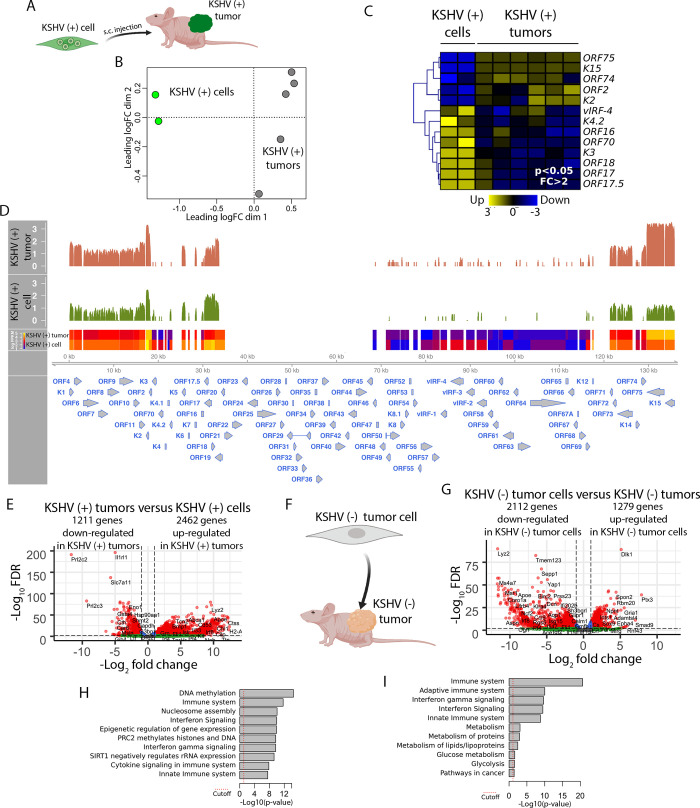
Fig 2. Transcriptional effects mediated by KSHV and by environmental cues in vivo.
(A) Scheme of the comparison between KSHV (+) cell and KSHV (+) tumor. (B) Multidimensional scaling plot for KSHV gene expression of KSHV (+) cells and KSHV (+) tumors. (C) Heat map for fold change expression of KSHV-encoded genes based on analysis of RNA sequencing data between KSHV (+) cells and KSHV (+) tumors. Only KSHV genes with statistical significance (p<0.05) are shown. (D) Histogram showing transcript coverage for KSHV-encoded genes, comparison of the transcription profiles of KSHV (+) cells and KSHV (+) tumors. Transcriptional levels of viral genes were quantified in reads per kilo base of coding region per million total read numbers (RPKM) in the sample. The y-axis represents the number of reads aligned to each nucleotide position and x-axis represents the KSHV genome position. (E) Volcano plot showing 3674 differentially expressed genes (DEGs) analyzed by RNA-Sequencing between KSHV (+) tumors and KSHV (+) cells. 1211 genes were down-regulated and 2462 genes were up-regulated in KSHV (+) tumors. (F) Scheme of the comparison between KSHV (-) cell and KSHV (-) tumor. (G) Volcano plot showing 3392 differentially expressed genes (DEGs) analyzed by RNA-Sequencing between KSHV (-) tumor cells and KSHV (-) tumors. 2112 genes were down-regulated and 1279 genes were up-regulated in KSHV (-) tumor cells. (H) Functional enrichment analysis based on the 3674 genes differentially expressed among KSHV (+) cells and KSHV (+) tumors. (I) Functional enrichment analysis based on the 3392 genes differentially expressed among KSHV (-) tumor cells and KSHV (-) tumors.

