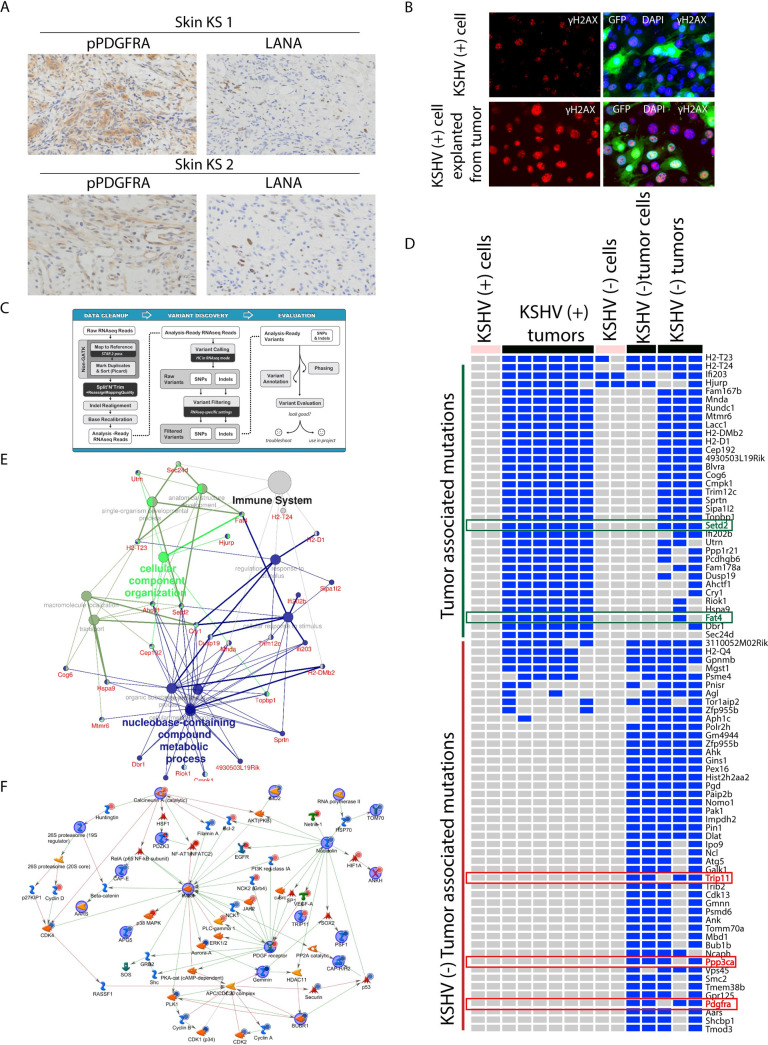
Fig 5. Analysis of the mutational landscape.
(A) Staining of AIDS-KS biopsies from an ACSR tissue microarray (TMA) showing high phospho-PDGFRA and low LANA staining in two characteristic samples. (B) Immunofluorescence analysis of ƴH2AX expression (red) was performed on GFP-positive KSHV (+) cells and GFP-positive KSHV (+) cells explanted from tumor; nuclei were counterstained with DAPI (blue). (C) The GATK workflow used to call host mutations. (D) Heat map of the most frequently and highly mutated genes. Genes with driver mutations in cancer are highlighted. (E) Network analysis of mECK36 KSHV (+) tumors associated mutations (tumor associated mutations). (F) Network modeling with genes mutated in KSHV (-) tumor associated mutations.

