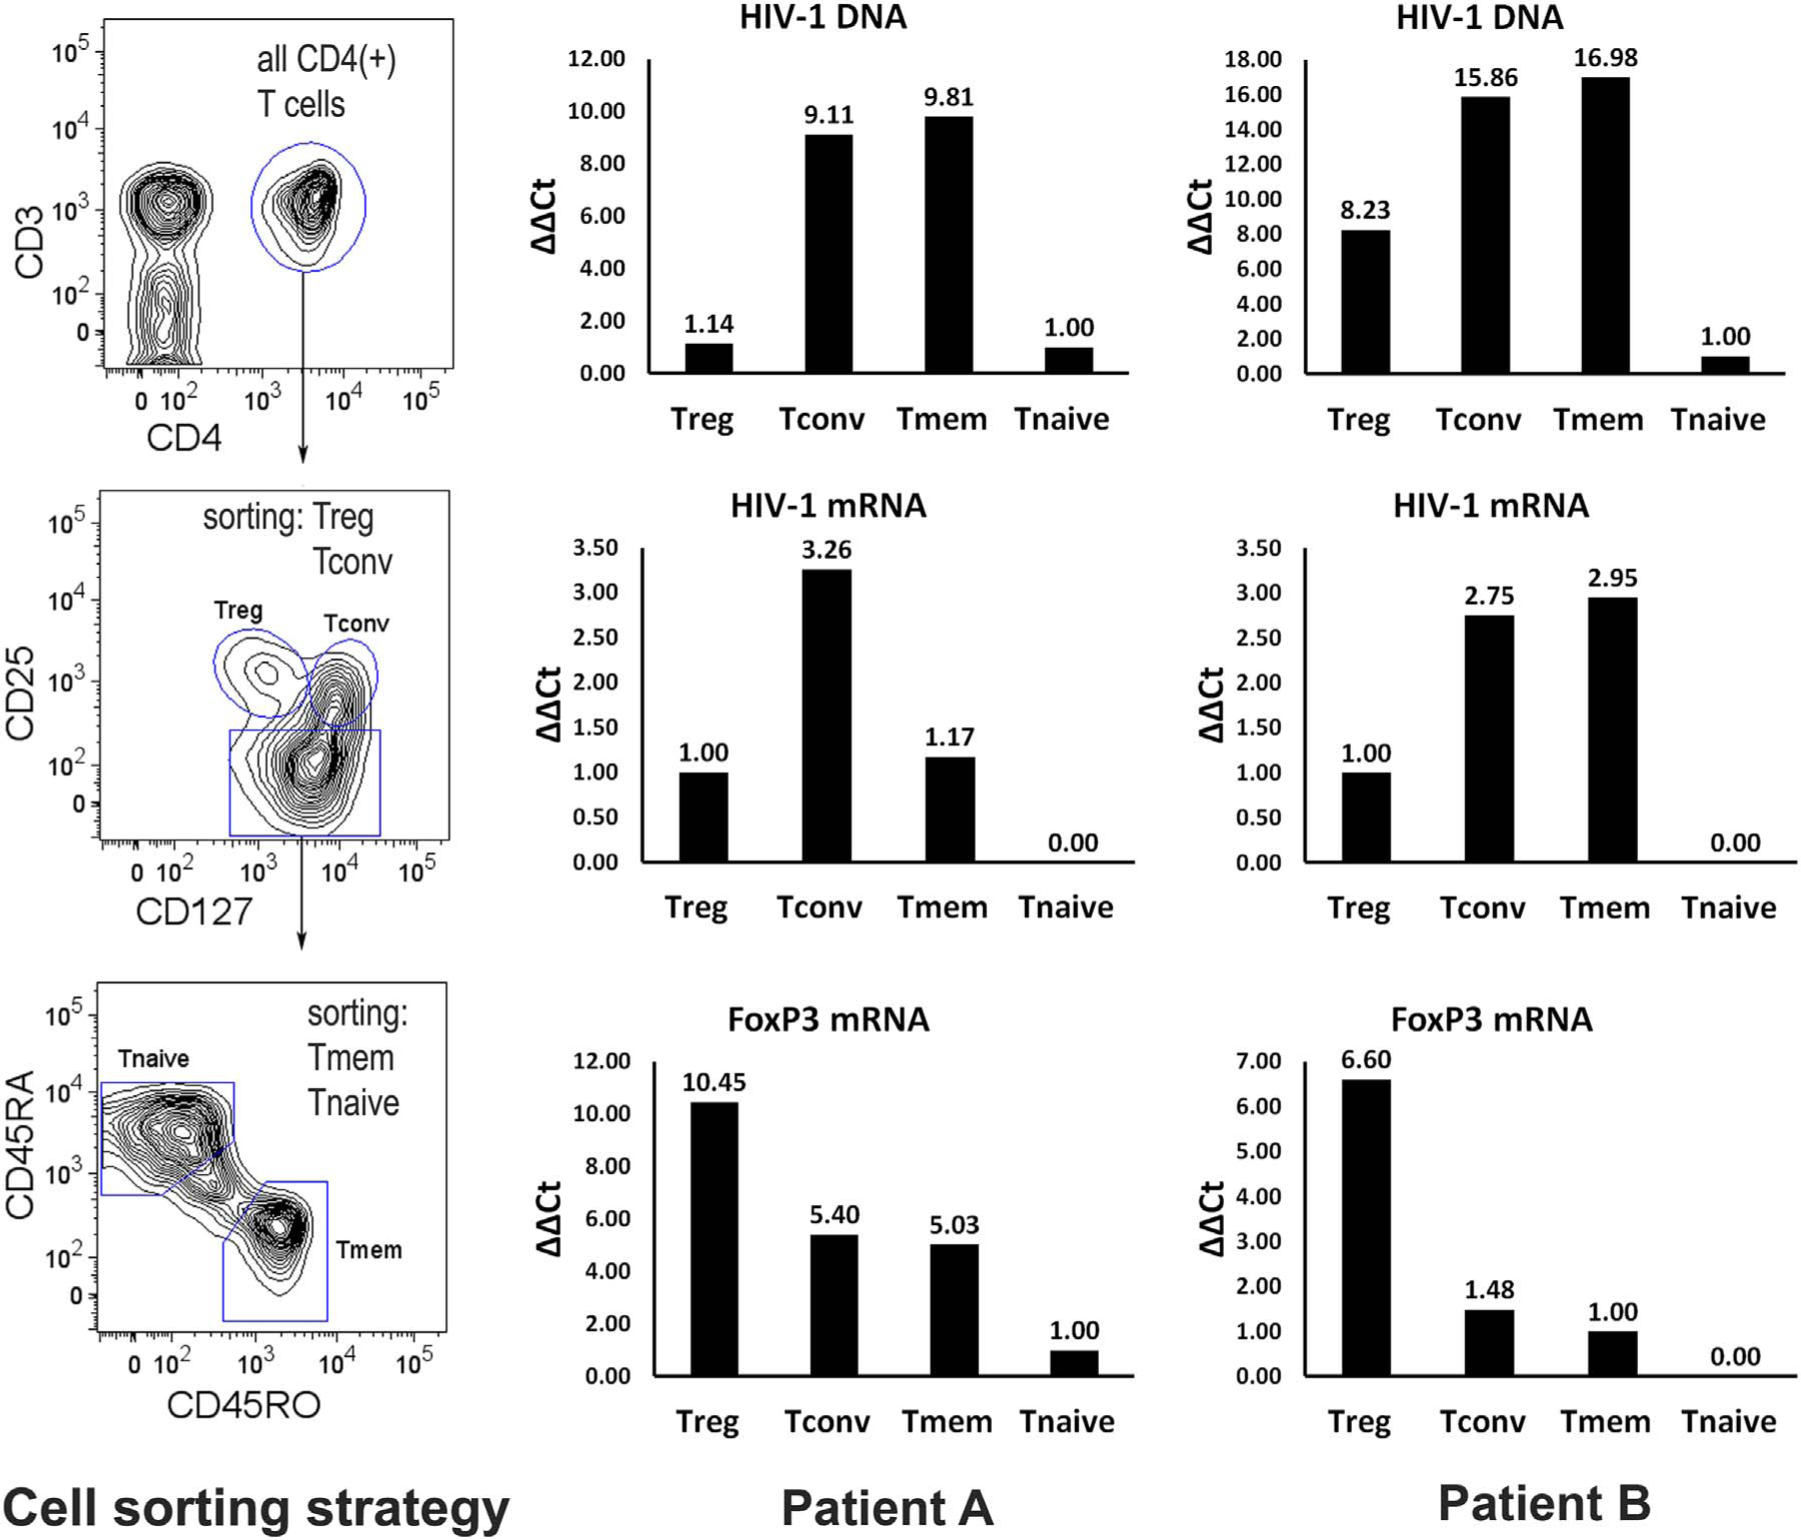
Fig. 2.

CD4 Tregs from HIV-1/AIDS patients express lower levels of HIV-1 DNA and viral mRNA than Tconvs and Tmems ex vivo. (Left panels) CD4 T cell populations were sorted from PBMC of newly infected (patient A) and chronically HIV-1 infected (patient B) individuals. Bar graphs depict HIV-1 total DNA (top), gag mRNA (middle), and host FoxP3 mRNA (bottom) for sorted Tregs (Tr), Tconvs (Tc), Tmems (Tm), and Tnaives (Tn) populations. Levels were measured in triplicate and the mean values are shown.
