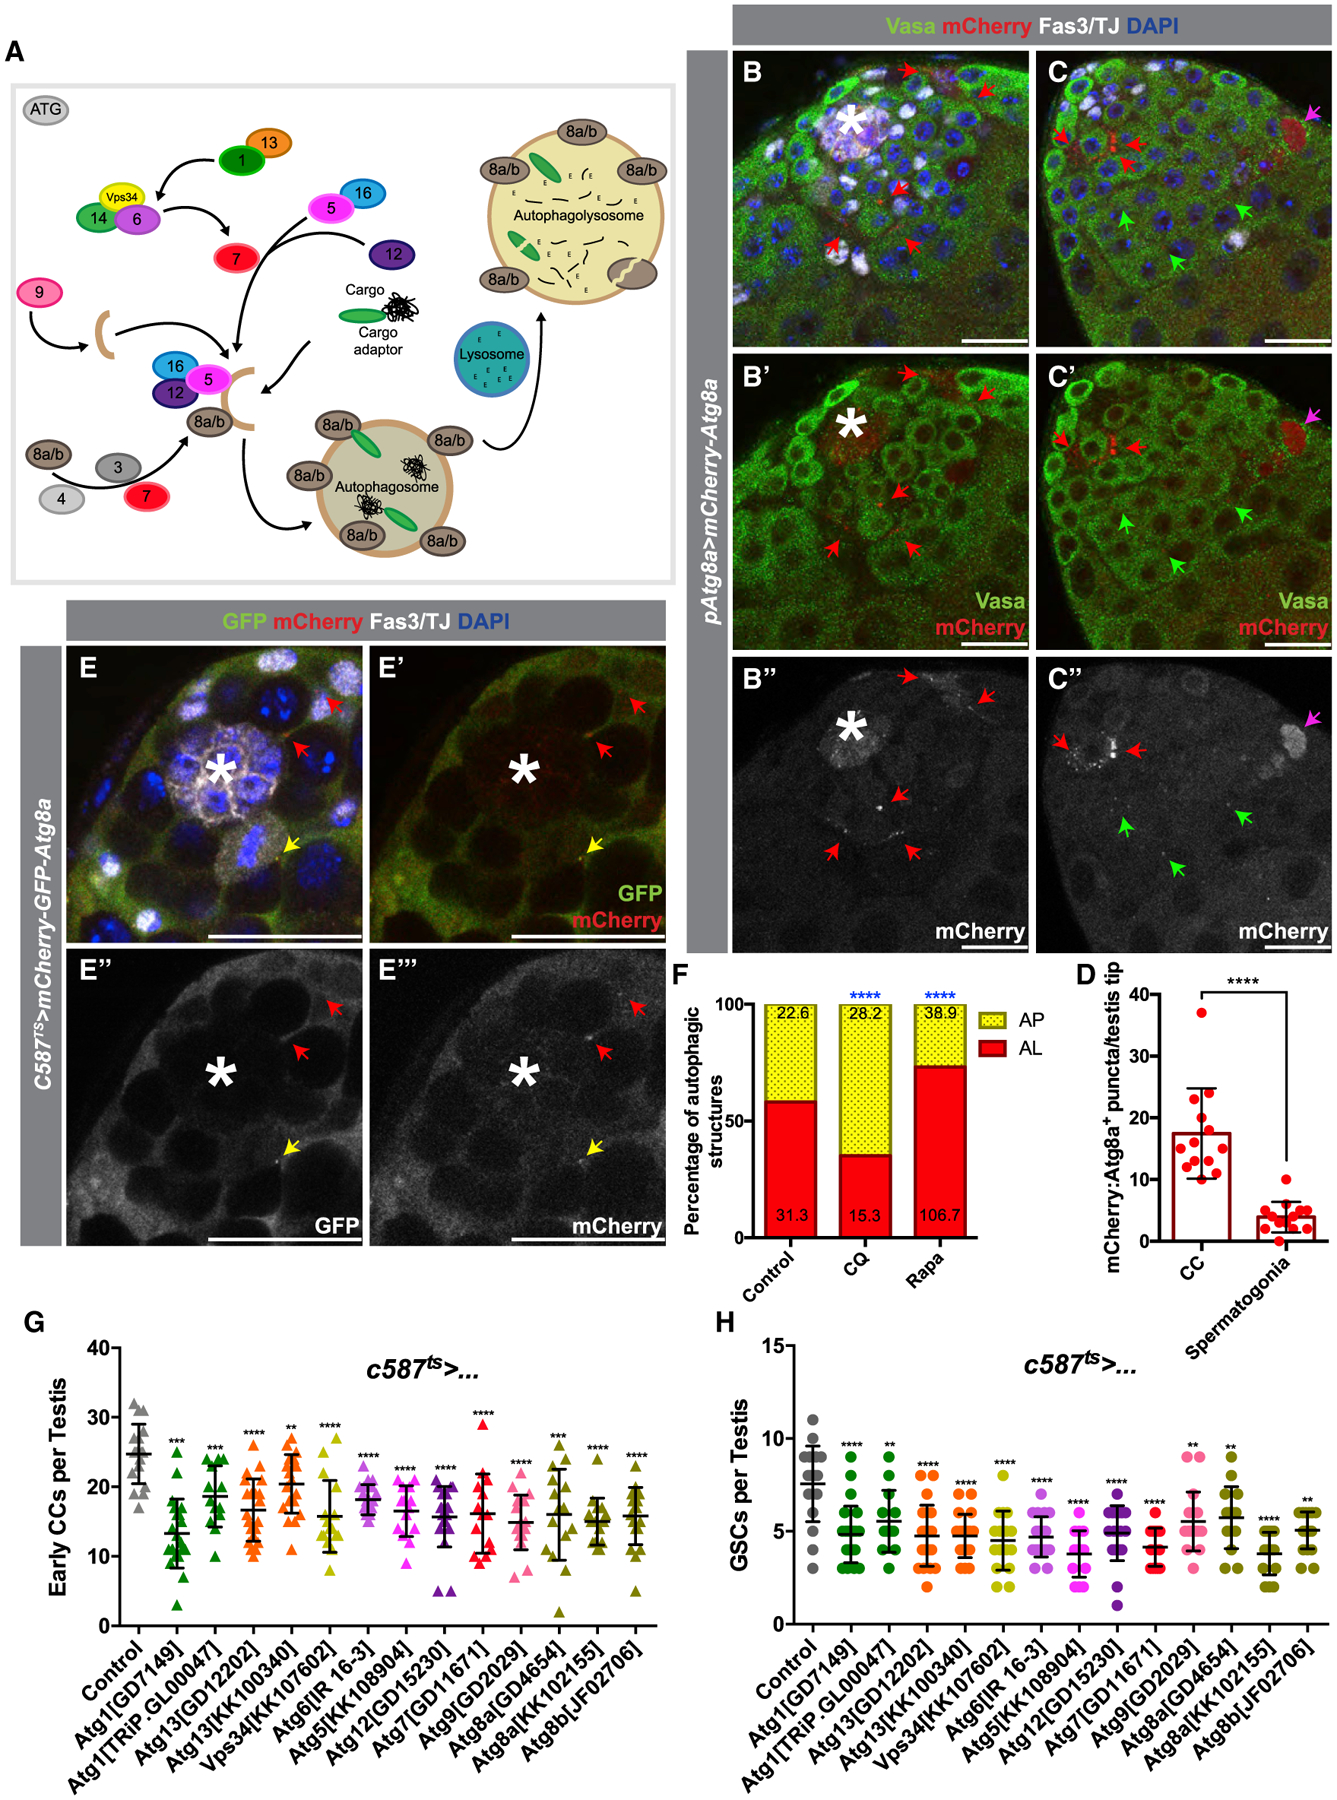
Figure 1. Basal Levels of Autophagy Are Required for CySC Maintenance and Function.

(A) Diagram of key proteins involved in autophagy, including many conserved Atg-family proteins required for AP formation.
(B–C’’) Two examples of testis tips in which APs (visualized by mCherry:Atg8a+ puncta) are shown to be enriched in early CCs (red arrows), with very few present in the germline (green arrows). The antibody against Vasa stains the germline, and the antibody against TJ marks the nuclei of early CCs, while Fas3 marks the hub (see STAR Methods). Occasionally, cytoplasmic mCherry:Atg8a is observed in dying germline cysts (pink arrow).
(D) Quantification of the number of APs per testis tips in the somatic CC tissue versus in early spermatogonia.
(E–E’’’) Example of the expression in CCs of a tandem-tagged GFP-mCherry-Atg8a probe. Autophagolysosomes (ALs) that can successfully acidify have quenched GFP signal (as seen by GFP−/mCherry+ puncta, red arrow), as opposed to APs that have not matured and acidified (double GFP+/mCherry+ puncta, yellow arrow).
(F) Quantification of the types of autophagic structures (see STAR Methods) in regular diet (RD), chloroquine (CQ) feeding, or rapamycin (RAPA) feeding. Numbers on each bar color represent the mean number of autophagic structures per testis tip (n = 10 testis per condition). Blue asterisks represent statistical information when compared to control.
(G and H) Quantification of very early CCs (including CySCs) (G) and GSCs (H) in testes from 10-day-old animals (see STAR Methods) in which autophagy-related genes have been knocked down by RNAi in early CCs with c587-Gal4ts.
In all images, asterisks (*) denote the hub; scale bars, 20 μm. For (D), (G), and (H), two-tailed t tests were used; error bars represent standard deviation. For (F), two-sided Fisher’s exact was used. *p < 0.05, **p < 0.01, ***p > 0.001, ****p < 0.0001; n.s., not significant.
