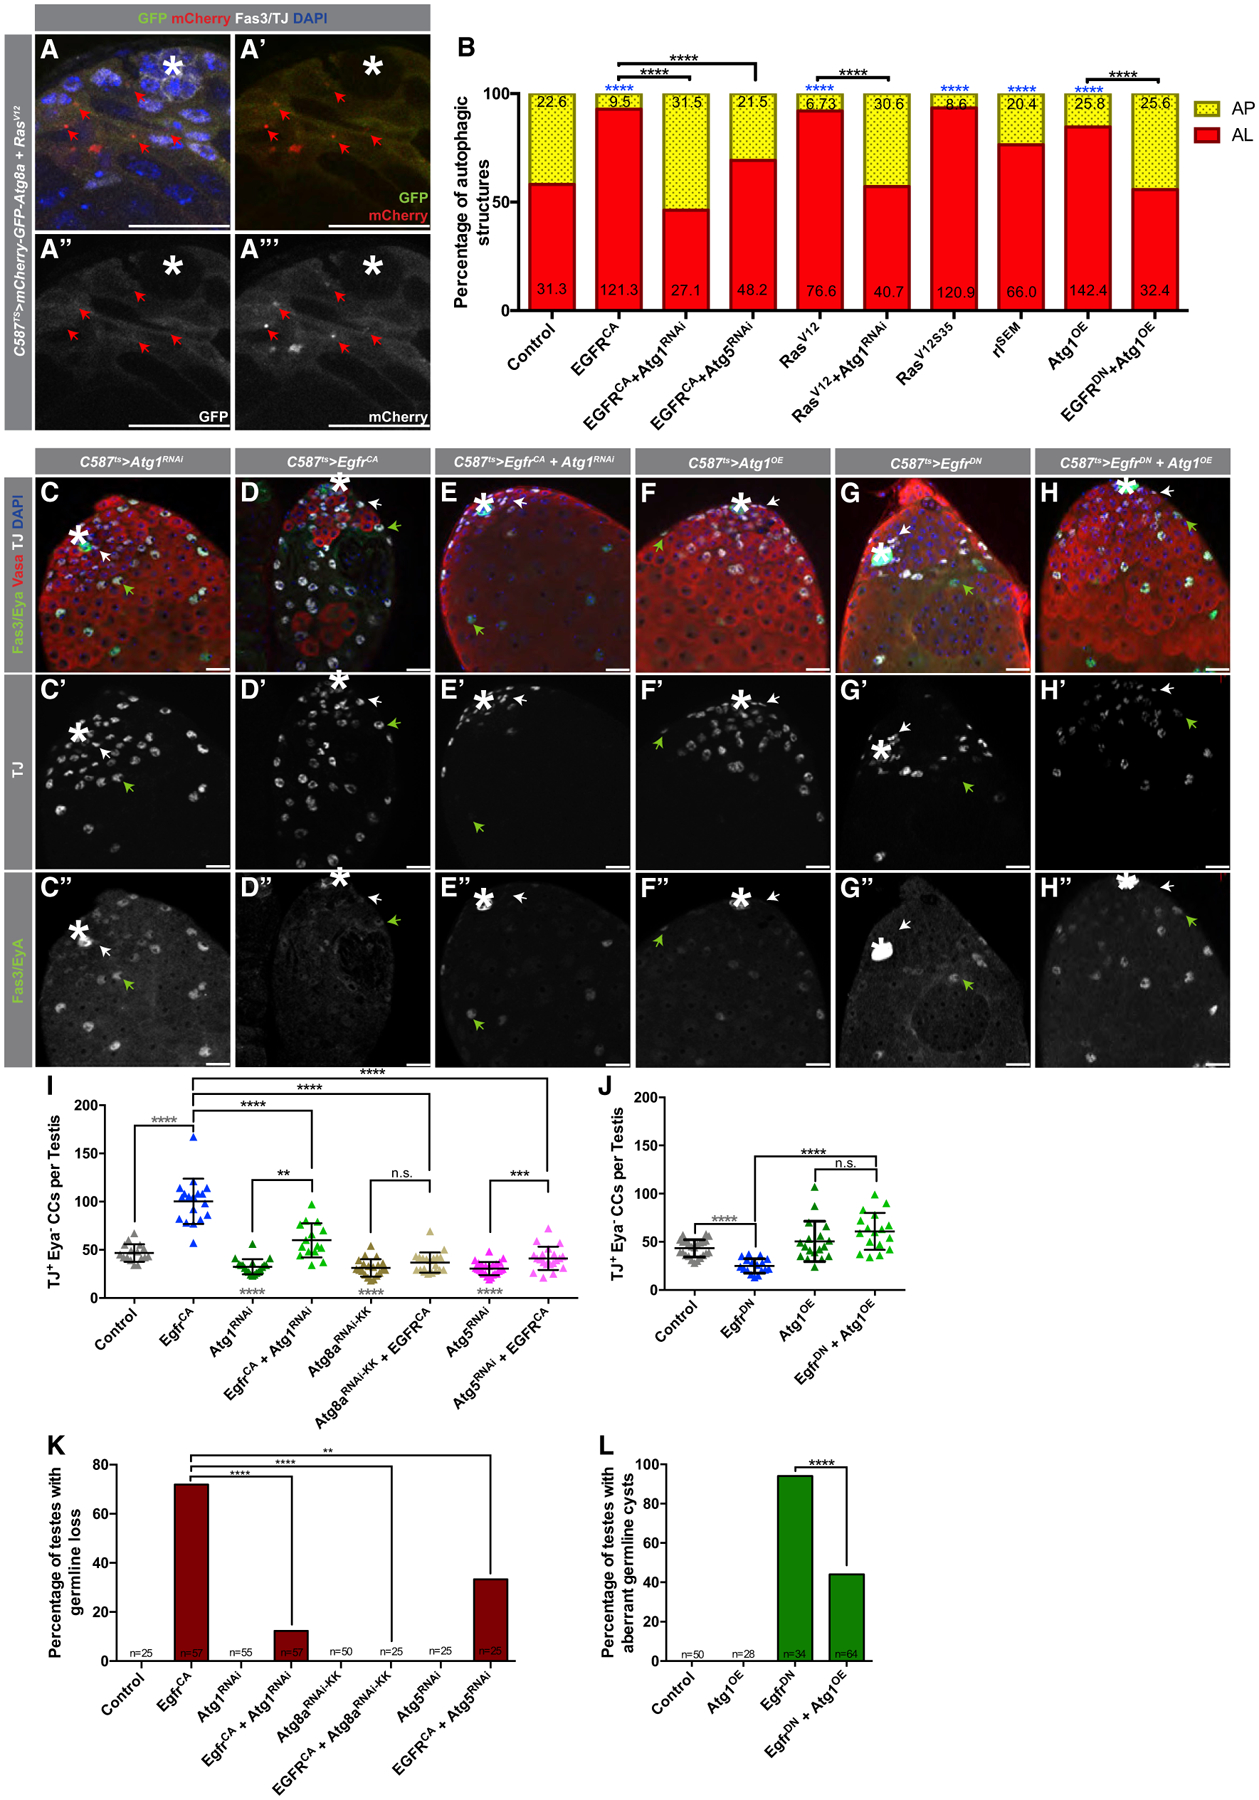
Figure 3. EGFR Acts Upstream of Autophagy-Related Genes in CCs to Regulate Autophagy.

(A–A’’’) Representative image of a testis tip from 5-day-old animals expressing the autophagic flux probe GFP:mCherry:Atg8a in CCs together with the overexpression of an activated Ras mutant (compare to Figure 1E–E’’’).
(B) Quantification of autophagic structures in the noted genotypes. Numbers on each bar color represent the mean number of autophagic structures per testis tip (n = 10 testes per condition). Blue asterisks represent statistical information compared to control. Control data reproduced from Figure 1F (RD) for comparison.
(C–E’’) Representative images of testes from 5-day-old animals expressing c587ts > Atg1RNAi+TdTomato (C–C’’), c587ts > EgfrCA+TdTomato (D–D’’), and c587ts > Atg1RNAi+EgfrCA (E–E’’) stained with antibodies against Fas3/Eya, Vasa, and TJ. Note the accumulation in (D–D’’) of early CCs, marked by TJ expression and Eya absence (white arrows). Green arrows point to double TJ+/Eya+-stained CCs.
(F–H’’) Representative images of testes from 10-day-old animals expressing c587ts > Atg1OE+TdTomato (F–F’’), c587ts > EgfrDN +TdTomato (G–G’’), and c587ts > Atg1OE+EgfrDN (H–H’’).
(I) Quantification of the number of early CCs (as marked by TJ+/Eya−) in 5-day-old animals with the c587TS driver.
(J) Quantification of the number of early CCs (as marked by TJ+/Eya−) in 10-day-old animals with the c587TS driver. Note that for (I) and (J), the control is (c587TS > TdTomato), and all single UAS-based transgenes were paired with UAS-TdTomato to take into account Gal4/UAS levels compared to double UAS combinations (see STAR Methods). Gray statistical information compared to control.
(K) Quantification of the percentage of testes in which germline loss was observed (Fisher’s exact was used).
(L) Quantification of the percentage of testes in which spermatogonial cysts with aberrant numbers were observed (Fisher’s exact was used) (Figures S3M–S3R show α-Spectrin stains used to aid in categorizing aberrant cysts).
In all images, asterisks (*) denote the hub; scale bars, 20 μm. For (I) and (J), two-tailed t tests were used; error bars represent standard deviation. For (B), (K), and (L), two-sided Fisher’s exact was used. *p < 0.05, **p < 0.01, ***p > 0.001, ****p < 0.0001; n.s., not significant.
