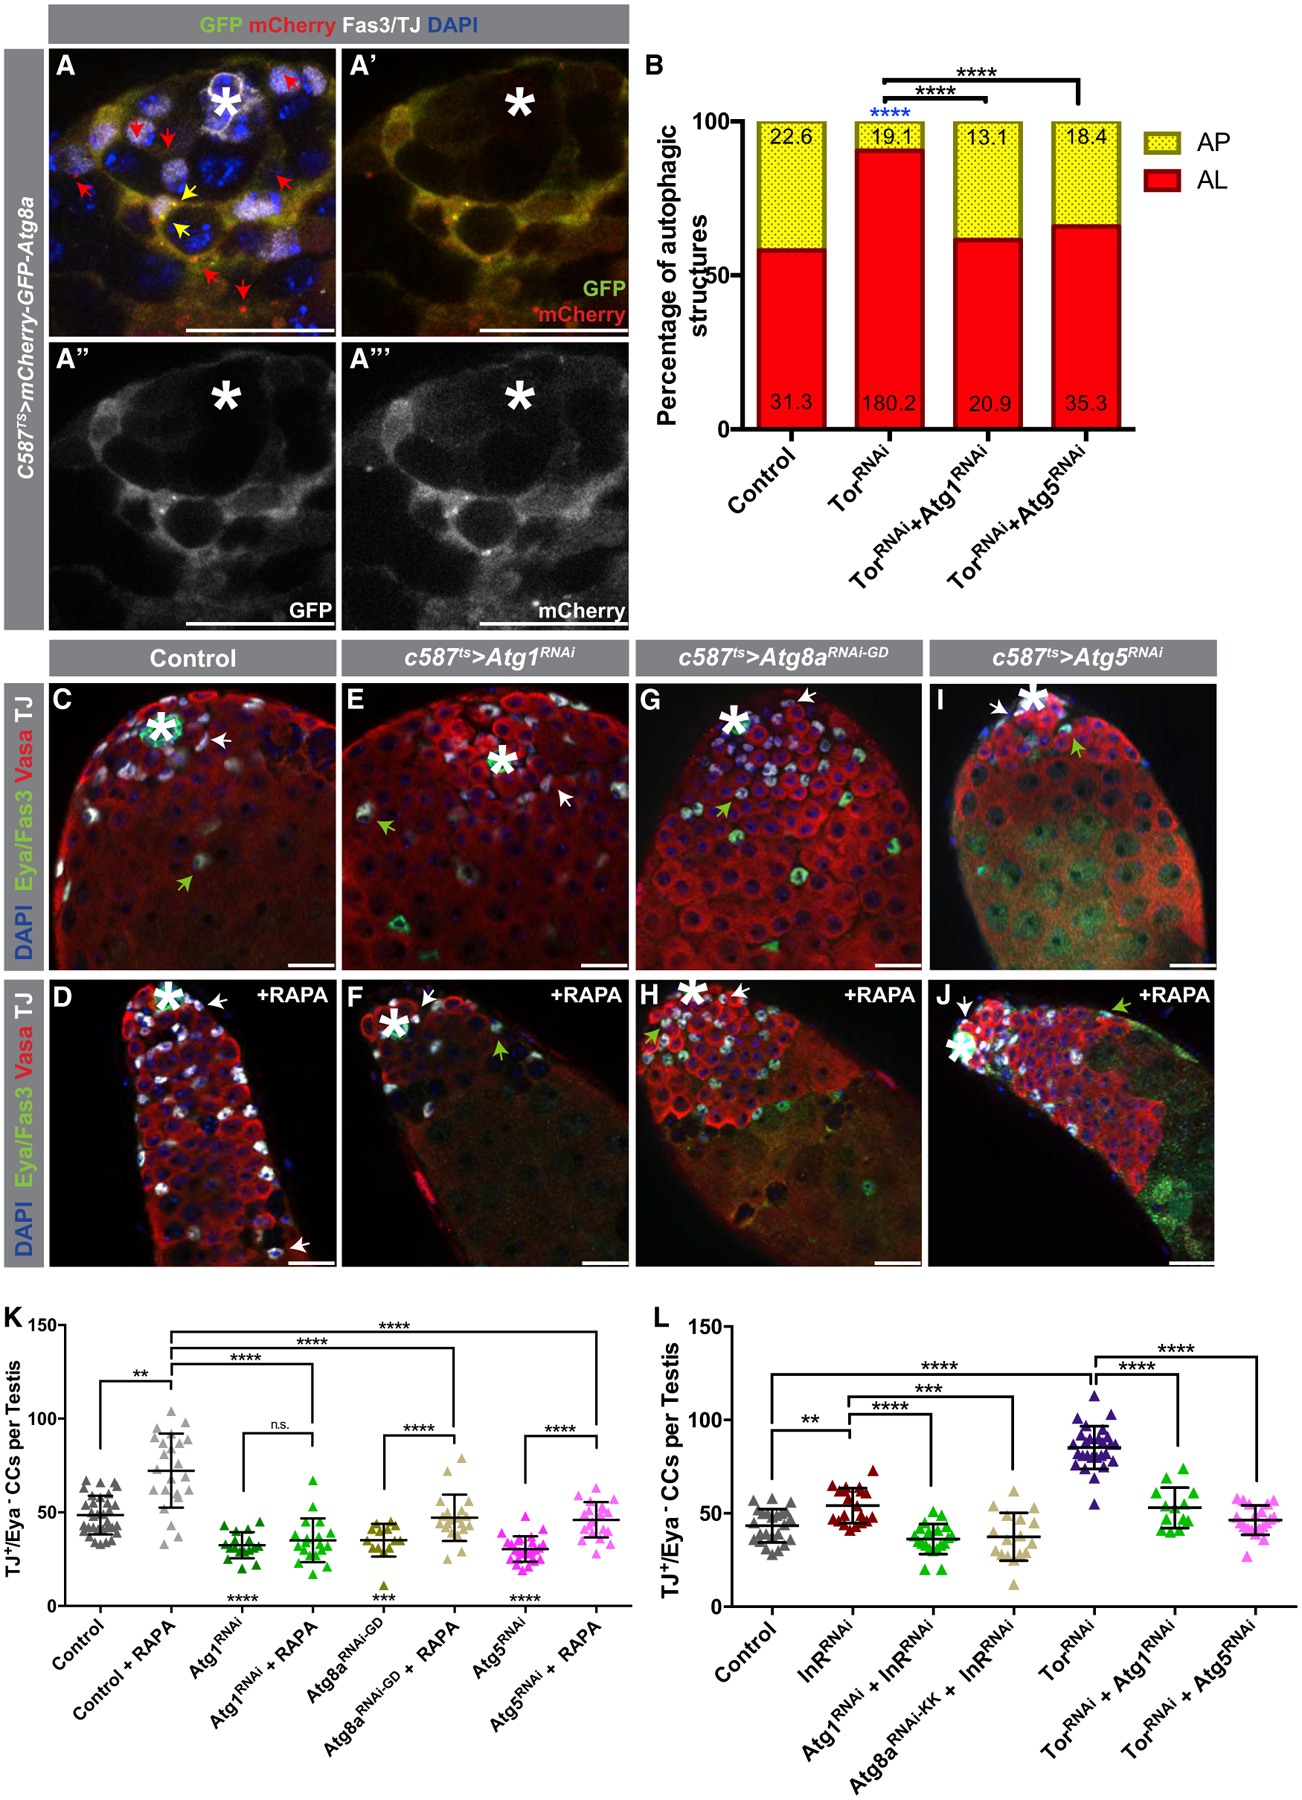
Figure 5. TOR Acts in Differentiating CCs to Suppress Autophagy.

(A–A’’’) Representative IF of a testis tip from flies expressing the GFP:mCherry:Atg8a probe. Red arrows point to mCherry+-only APs, and yellow arrows point to GFP+/mCherry+ APs.
(B) Quantification of autophagic structures in the noted genotypes (all with c587TS). Blue asterisks represent statistical information compared to control. Numbers on each bar color represent the mean number of autophagic structures per testis tip (n = 10 testis per condition). Control data reproduced from Figure 1F for comparison.
C–J) Examples of testes from 5-day-old control animals (C and D) and from animals expressing c587ts > Atg1RNAi (E and F), c587ts > Atg8aRNAi (G and H), or c587ts > Atg5RNAi (I and J) that were either fed a RD (C, E, G, and I) or food containing RAPA for 5 days (D, F, H, and J). White arrows point to TJ+/Eya− early CCs, and green arrows point to TJ+/Eya+ CCs.
(K) Quantification of numbers of early CCs (TJ+/Eya−) in the genotypes shown in (C)–(J).
(L) Quantification of the numbers of early CCs in animals of the noted genotypes. Single UAS-based transgenes were paired with UAS-TdTomato for consideration of Gal4/UAS-levels.
In all images, asterisks (*) denote the hub; scale bars, 20 mm. For (B), Fisher’s exact was used. For (K) and (L), two-tailed t tests were used; error bars represent standard deviation. *p < 0.05, **p < 0.01, ***p > 0.001, ****p < 0.0001; n.s., not significant.
