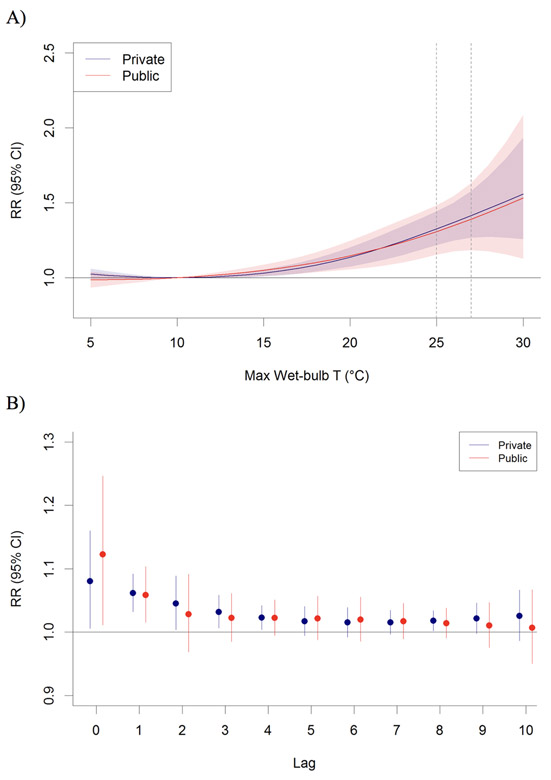
Figure 3. Temperature-Dependence of Kidney Stone Presentations in South Carolina by Payer Status.
A) Relative risk of kidney stone presentations associated with maximum daily wet-bulb temperatures by private and public health insurance, cumulated over a 10-day lag period, relative to 10 °C. The vertical dashed lines at 25.1 °C and 27 °C represent the 90th and 99th percentile of maximum daily wet-bulb temperatures, respectively. The blue and red lines and shaded areas are the sex-specific RR and 95% CI, respectively. B) Lagged RR associated with maximum daily wet-bulb temperatures at the 99th percentile and kidney stone presentations for individuals with private and public health insurance over a 10-day period, relative to 10 °C. The blue and red dots are the RRs and the whiskers the 95% CI for each day following exposure for private and public health insurance, respectively. Natural cubic spline knots were placed at the 50th and 90th percentile of the temperature range and 2 knots were placed at equal intervals in the log scale in the lag dimension.

