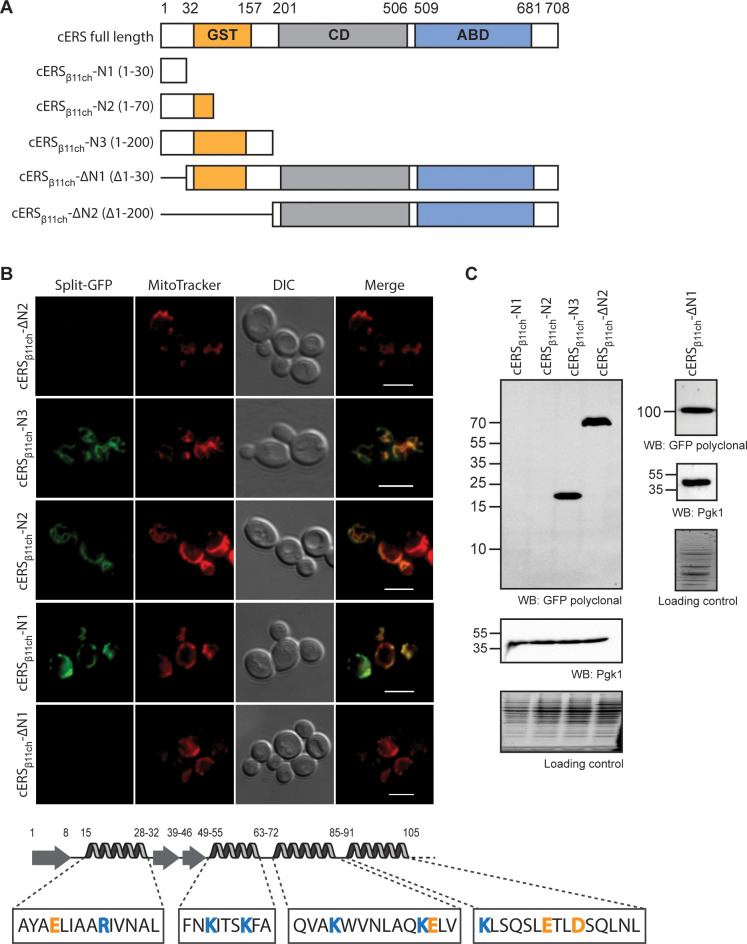
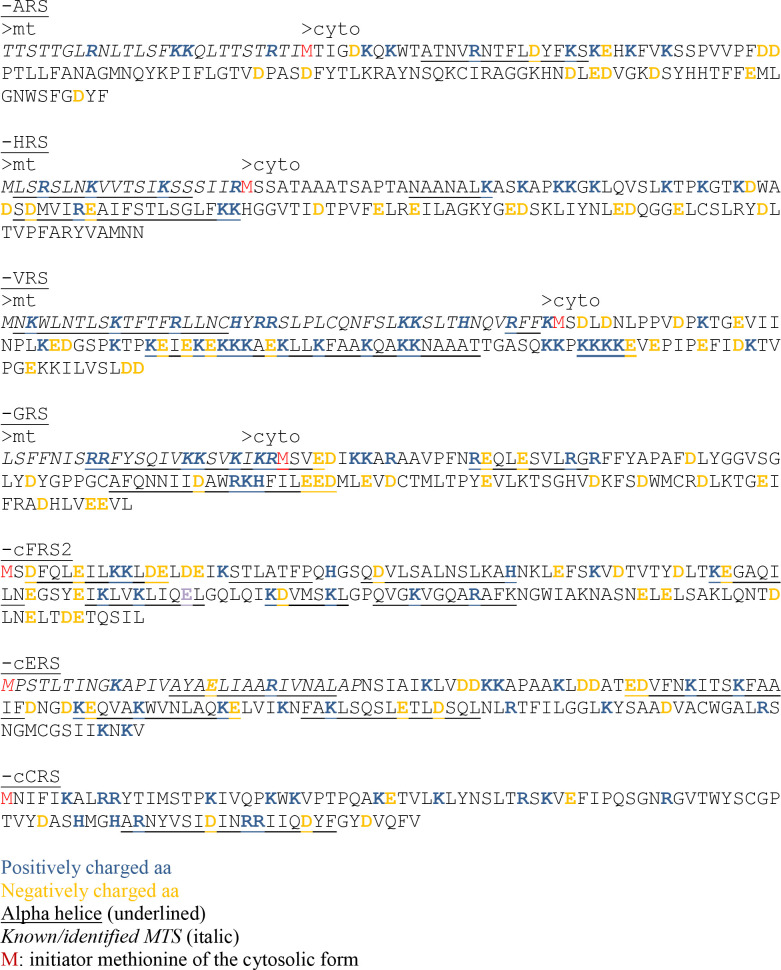
Figure 4. The BiG Mito-Split-GFP is a suitable tool to delimit regions containing non-canonical MTSs.
(A) Schematic representation of the cERS fragments fused to GFPβ11ch. Orange boxes correspond to the GST-like domain necessary for Arc1 interaction (GST), the grey boxes represent the catalytic domain (CD), and the blue box, the tRNA-binding domain generally named anti-codon binding domain (ABD). Numbering above corresponds to cERS amino acids residues. (B) Fluorescence microscopy analyses of the BiG Mito-Split-GFP strain expressing the cERS variants shown on A. Mitochondria were stained with MitoTracker Red CMXRos; scale bar: 5 µm. The secondary structure (according to Simader et al., 2006) of the smallest peptide that still contains the non-conventional MTS of cERS is described together with the amino acid sequence of each helices. Positively and negatively charged amino acids are shown in orange and blue respectively. (C) Immunodetection of the cERS variants in BiG Mito-Split-GFP whole cell extracts using anti-GFP antibodies. Quantity of proteins loaded in each lane was estimated using anti-Pgk1 antibodies or by the stain-free procedure. The bands corresponding to the mutants N1 and N2 could not be detected. The representative fields or gel are shown.


