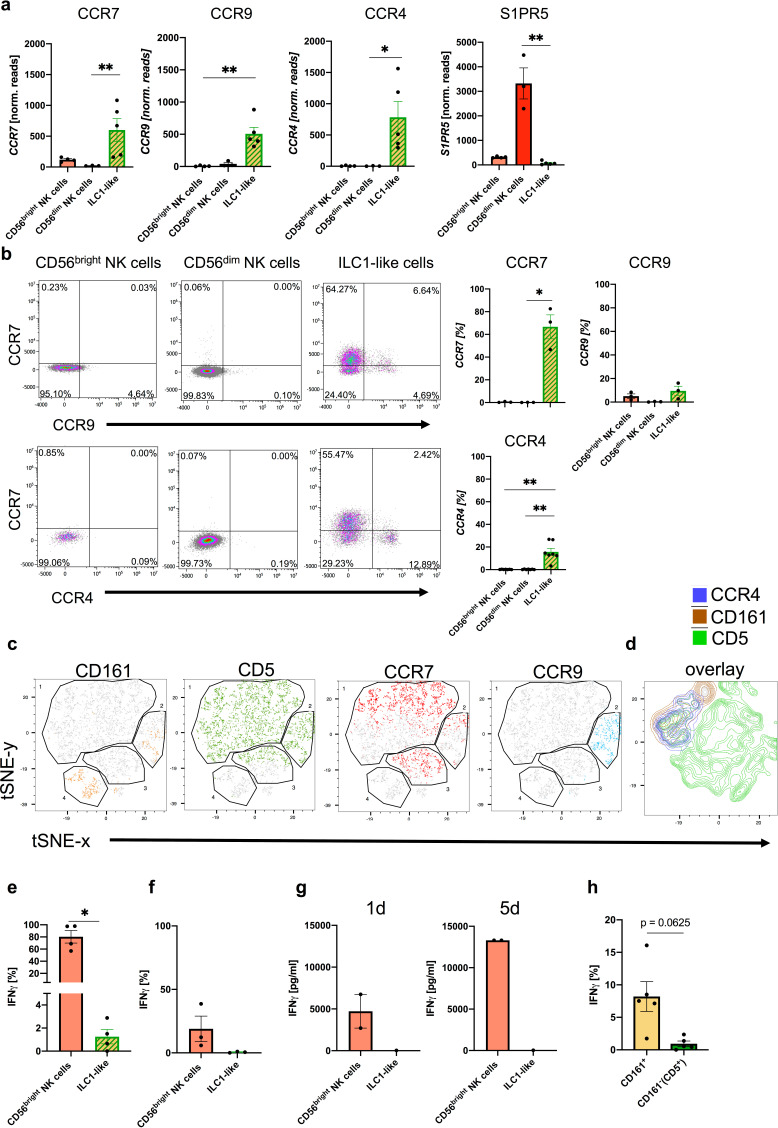
Figure 2. CD5+ and CD161+ ILC1-like subsets are distinguished by differential chemokine receptor expression and functionality.
(a) Expression of CCR7 (left corner), CCR9 (left middle), CCR4 (right middle), and S1PR5 (right corner) determined by RNA sequencing for CD56bright NK cells (n = 4), CD56dim NK cells (n = 3), and ILC1-like cells (n = 5). (b) Surface expression of chemokine receptors on CD56bright NK cells, CD56dim NK cells, and ILC1-like cells in ex vivo isolated MNC from CB. Representative dot plots and quantification of CCR7 and CCR9 (n = 3) or CCR7 and CCR4 (n = 7) is shown. (c and d) t-SNE plots for expression of CD161, CD5, CCR7, and CCR9 as well as an overlay of CD161, CD5, and CCR4 expression (rightmost panel) on ILC1-like cells (n = 3) calculated with 500 iterations (see Figure 1—figure supplement 1 for gating of ILC1-like cells). (e and f) Freshly isolated CB MNC were either stimulated with IL-12 (5 ng/ml) and IL-18 (50 ng/ml) overnight or with PMA/Ionomycin for 4 hr to measure intracellular expression (n = 5/3). (g) CB ILC1-like cells were sorted and stimulated with IL-12/IL-18. At day 1 and 5 supernatant was taken and analysed for IFNγ secretion (n = 1–2). (h) MNCs stimulated with IL-12/IL-18 were further gated on CD161- and CD161+ cells and IFNγ secretion was determined. The heights of the bars represent the mean ± SEM. Levels of significance were calculated with a One-Way ANOVA with a multiple correction post-test (Kruskal-Wallis test) (a and b), by a Mann-Whitney test (e–g) and Wilcoxon ranked test (h), * p-value<0.05, ** p-value<0.01, *** p-value<0.001. Data represent at least three different donors (a–f, h) as well as one to two donors (g) and two experiments.

