
Figure 3: Bioconductor workflow for analyzing single-cell data.
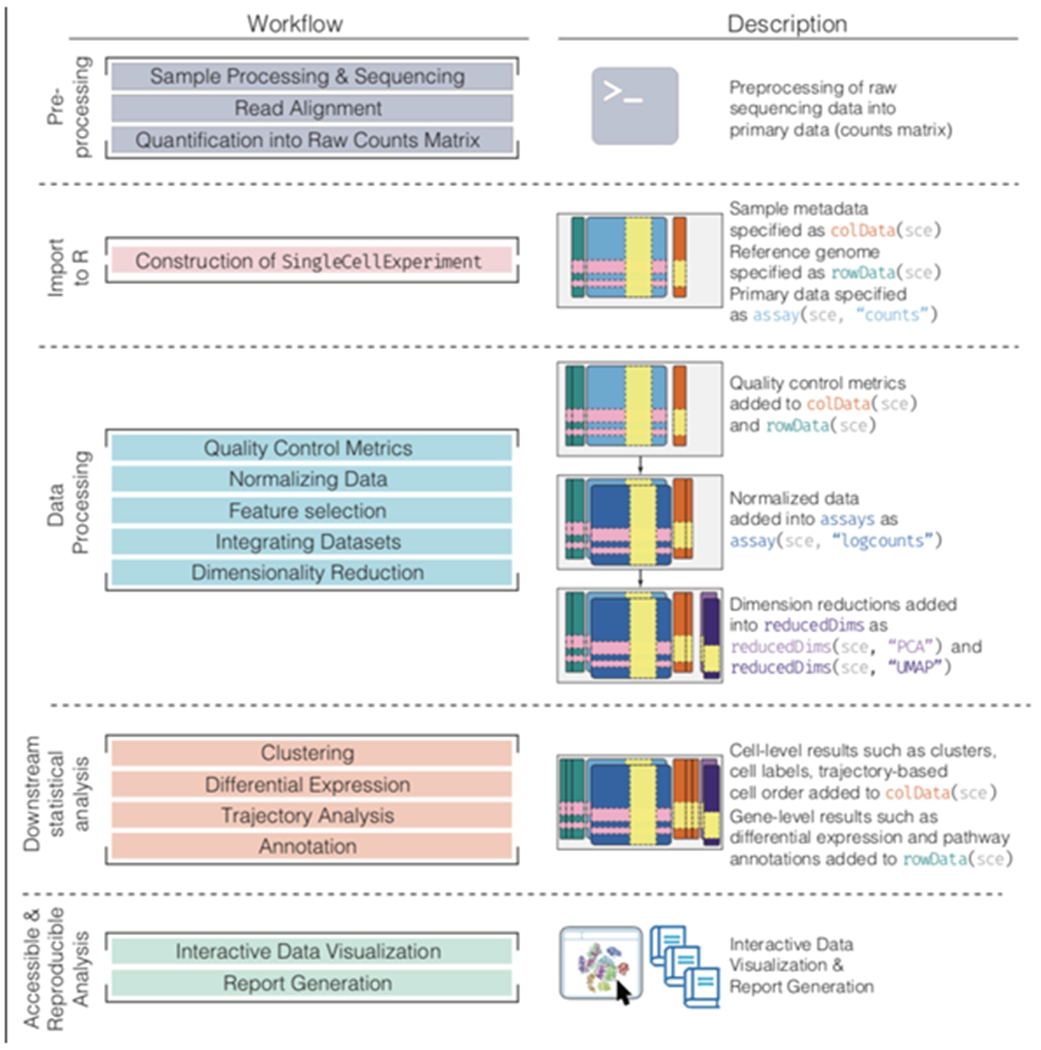
A typical analytical workflow using Bioconductor leads to the creation and evolution of a SingleCellExperiment (or sce) object during data processing and downstream statistical analysis (left column). An example of a sce object evolving throughout the course of a workflow is shown, including visualization, analysis, and annotation (right column).