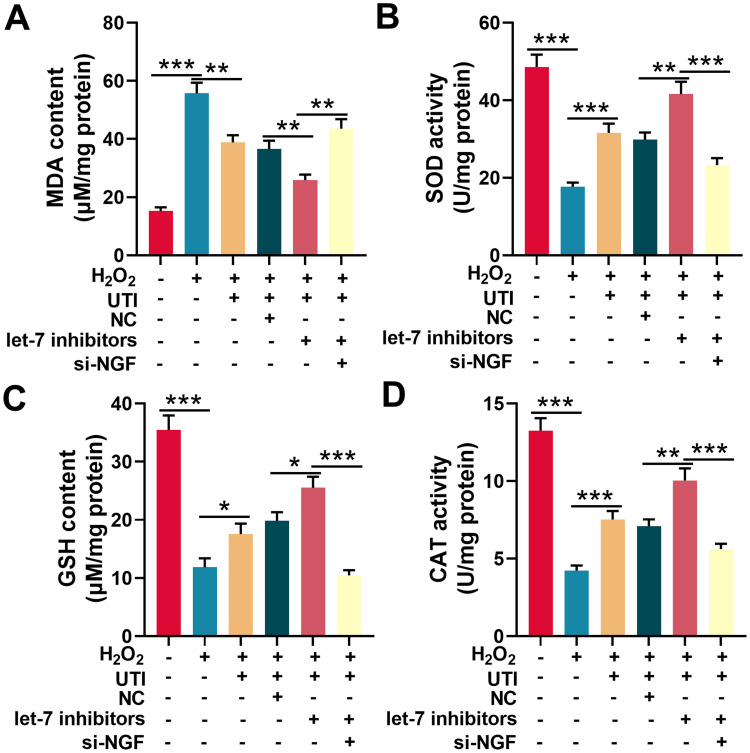
Figure 6.
UTI repressed oxidative stress of Schwann cells induced by H2O2. MDA level (A), SOD activity (B), GSH level (C) and CAT activity (D) were detected with corresponding kit respectively after Schwann cells were incubated with H2O2. *P < 0.05, **P < 0.01, and ***P < 0.001.
Abbreviations: UTI, ulinastatin; si-NGF, NGF siRNA; MDA, malondialdehyde; SOD, superoxide dismutase; GSH, glutathione; CAT, catalase.

