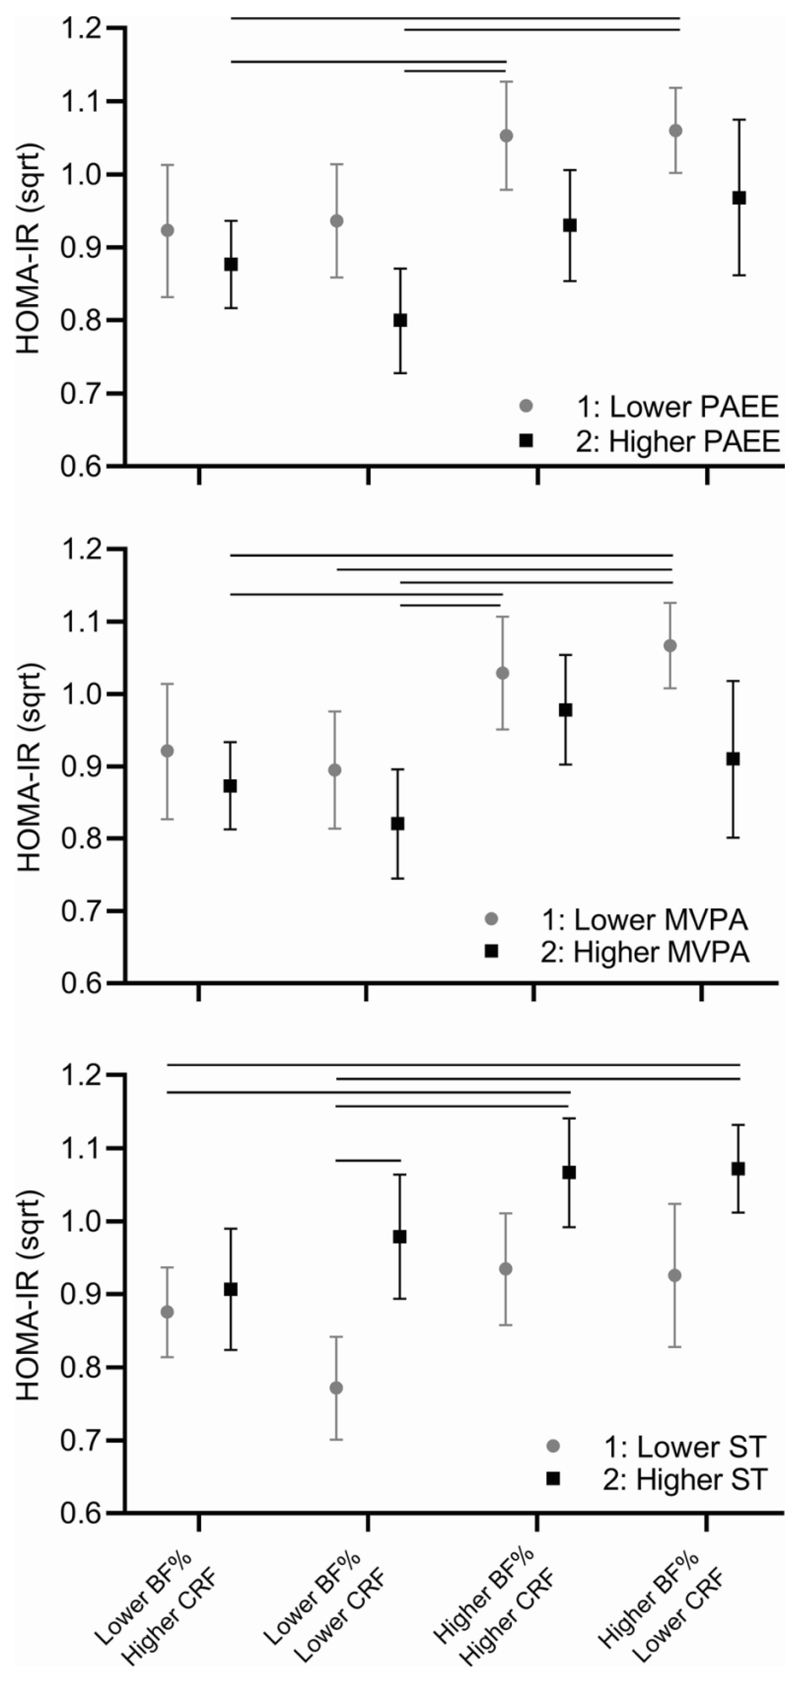
Figure 3.
Differences in HOMA-IR among children with different levels of body fat percentage (BF%), allometrically scaled cardiorespiratory fitness for lean mass (LM1.13), and physical activity energy expenditure (PAEE), moderate to vigorous physical activity (MVPA), or sedentary time (ST). N=lower BF%/higher CRF/lower PA or higher ST = 32; lower BF%/higher CRF/higher PA or lower ST = 75; lower BF%/lower CRF/lower PA or higher ST = 37; lower BF%/lower CRF/higher PA or lower ST = 52; higher BF%/higher CRF/lower PA or higher ST = 47; higher BF%/higher CRF/higher PA or lower ST = 45; higher BF%/lower CRF/lower PA or higher ST = 79; higher BF%/higher CRF/higher PA or lower ST = 45. Lines between groups denotes a statistically significant difference between groups at p<0.05.

