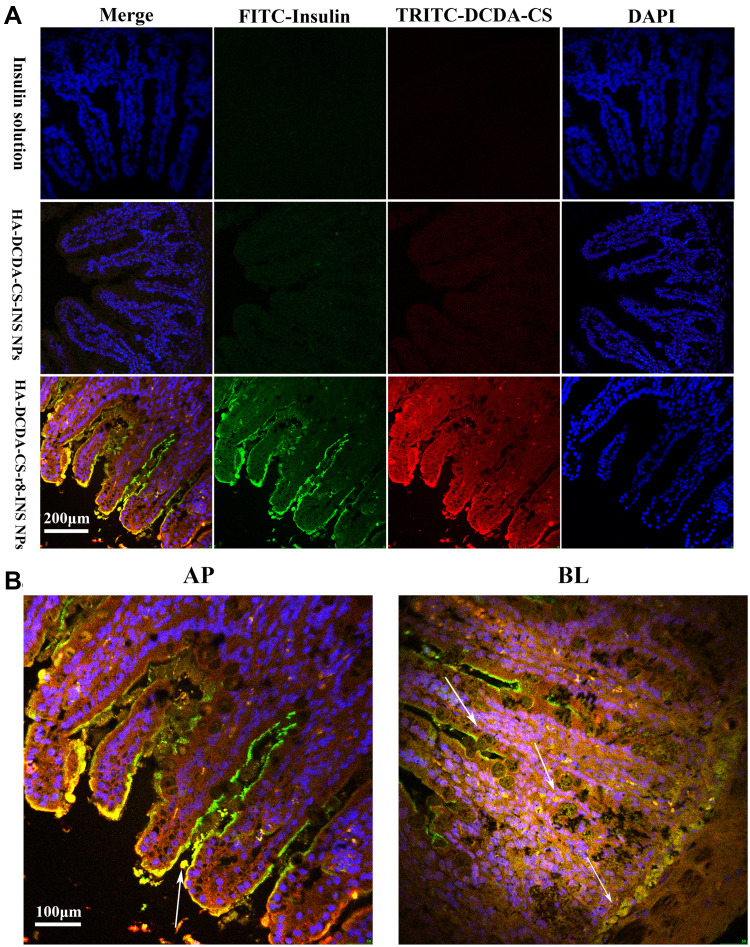
Figure 9.
Intestinal sections in vitro. (A). Representative fluorescence-based images of intestinal villi after administration of fluorescently-labeled NPs in TID rats. Insulin was labeled with FITC, DCDA-CS was labeled with TRITC, and the nucleus was stained with DAPI. (B). White arrows indicate where HA-DCDA-CS-r8-INS NPs have been absorbed into the intestinal villi (yellow fluorescence).

