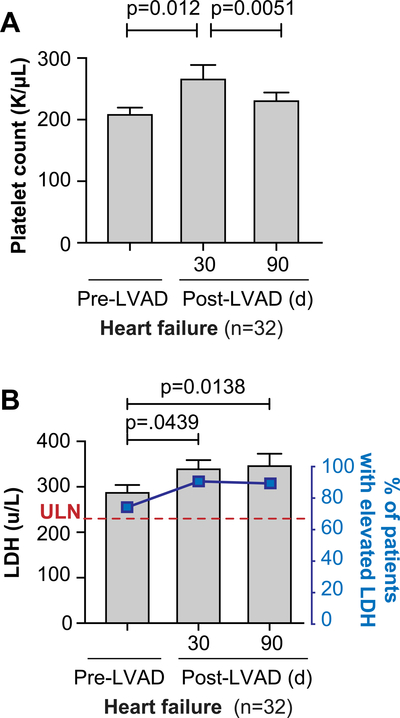
Figure 1. Platelet counts and lactate dehydrogenase (LDH) levels in patients with heart failure prior to and longitudinally following LVAD implantation.
(A) Circulating platelet counts were measured in patients with heart failure (n=32) prior to LVAD implantation (pre-LVAD) and again 30 days and 90 days post-LVAD implantation (post-LVAD). (B) Circulating levels of LDH were measured prior to LVAD implantation (pre-LVAD) and again 30 days and 90 days post-LVAD implantation (post-LVAD). The left axis, and the corresponding bars and p-values, reflect the measured units per liter (u/L). The dotted red line reflects the upper limit of the normal (ULN, which was 230 u/L based on our clinical laboratory’s reference range). The right axis shows the percentage of HF patients who had an LDH above the upper limit of normal (ULN). Numbers on the top refer to the p-value.

