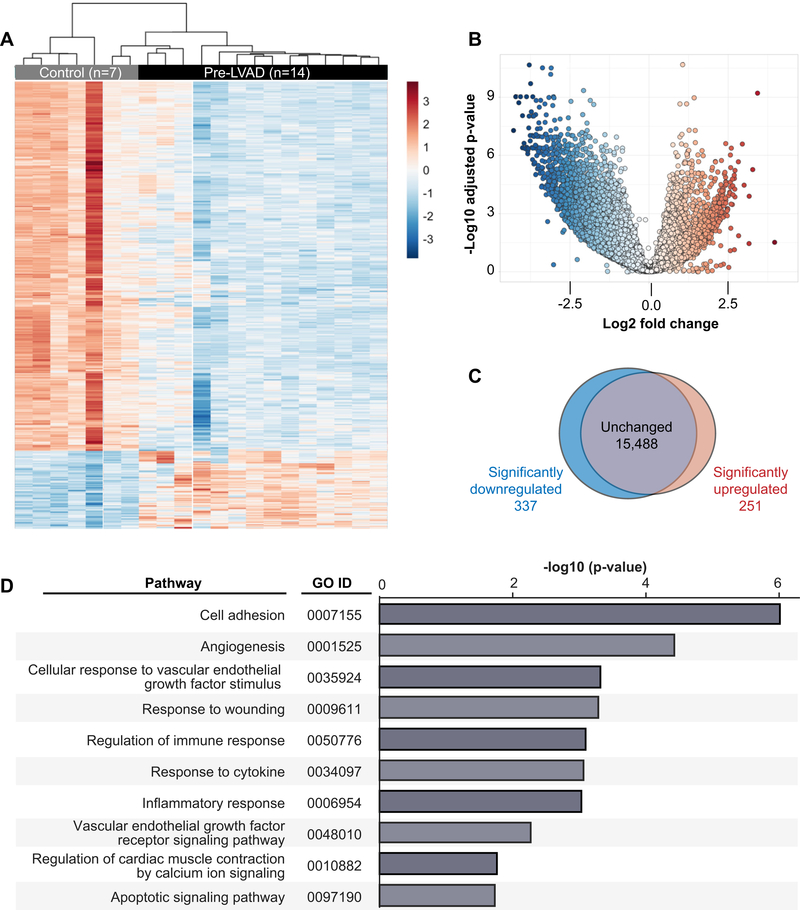
Figure 3. The platelet transcriptome is altered in patients with heart failure prior to LVAD implantation.
Platelets were isolated from heart failure patients prior to LVAD implantation (pre-LVAD, n=14) or matched control donors (Control, n=7). The platelet transcriptome was analyzed by next generation RNA-sequencing and compared between heart failure patients and control donors. (A) Heat map, (B) volcano plot, and (C) Venn diagram of significantly (FDR<0.05) differentially expressed transcripts between heart failure patients and control donors. In the heat map, each row represents a differentially expressed gene and each column represents a unique patient or control donor. Red indicates transcripts that were significantly upregulated and blue indicates transcripts that were significantly down-regulated. (D) Gene ontology (GO) pathway analysis for significantly differentially expressed transcripts (n=588, FDR<0.05) in heart failure patients compared to control donors.

