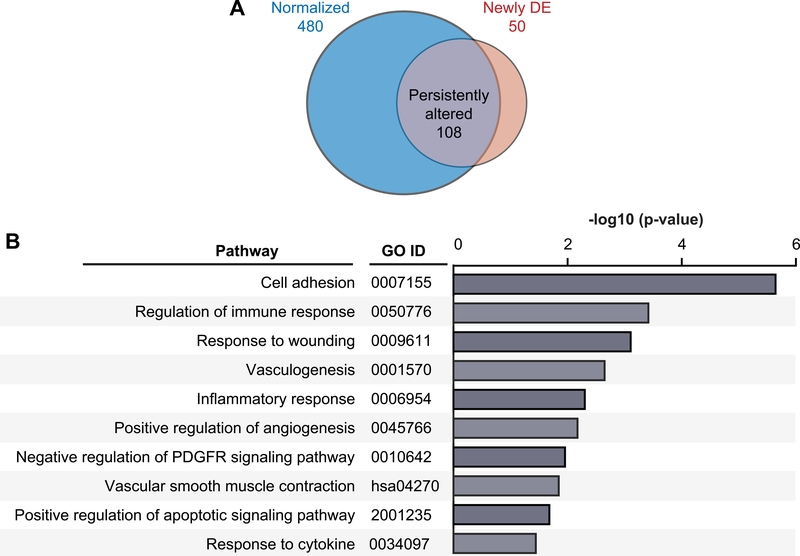
Figure 5. Pathway analyses of differentially expressed transcripts in platelets from heart failure patients prior to and 90 days following LVAD implantation.
(A) Venn diagram of platelet transcripts whose expression normalized (as compared to control subjects) in heart failure patients 90 days after LVAD implantation (blue, n=480), remained significantly persistently altered (grey, n=108; FDR<0.05) 90 days after LVAD implantation, or were newly significantly differentially expressed (orange, n=50; FD<0.05). (B) Gene ontology (GO) pathway analysis for all differentially expressed transcripts in heart failure patients that normalized 90 days after LVAD implantation (n=480). In all panels, “n” refers to transcript number. (DE = differentially expressed).

