Fig. 1.
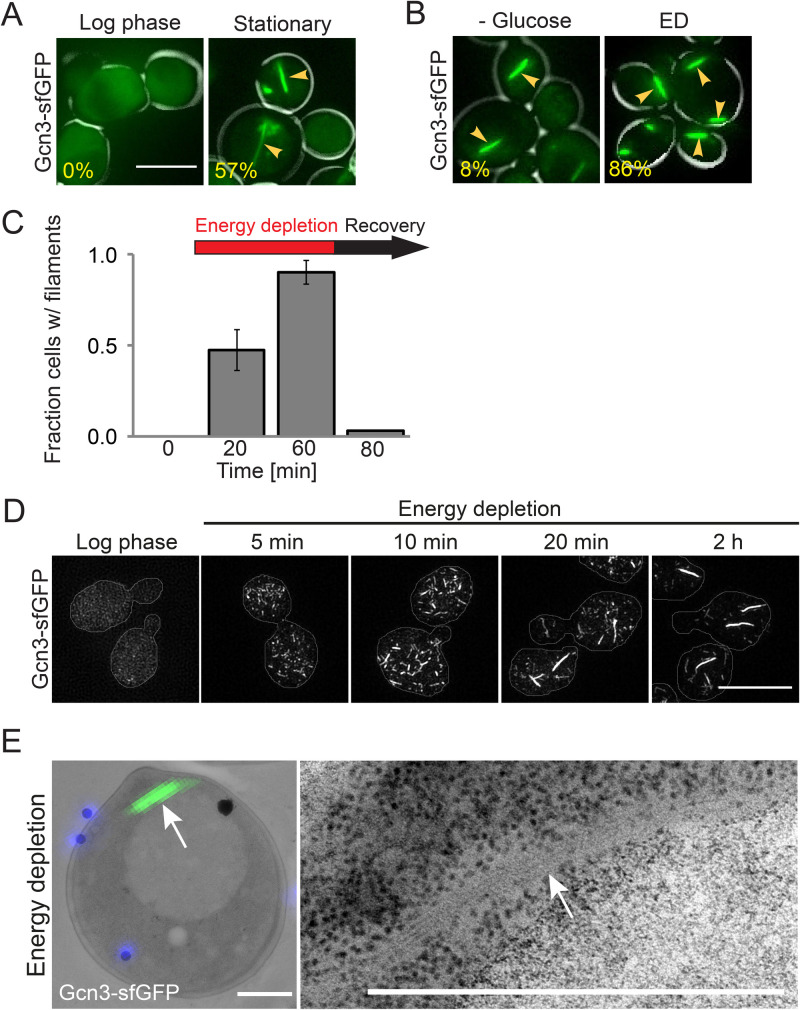
eIF2B filament formation is a starvation response. (A) Live-cell fluorescence microscopy of S. cerevisiae expressing Gcn3–sfGFP(V206R) in log phase and after 3 days of growth in SC medium (Stationary). Note that log phase cells do not show filaments. Arrows point at filaments. The percentage of cells with filaments is shown at the lower left corner of each panel (n>100). Scale bar: 5 µm. (B) Gcn3–sfGFP(V206R) localization after 30 min of glucose depletion (-Glucose) and after 30 min of energy depletion (ED) with 20 mM 2-deoxyglucose (2-DG) and 10 µM antimycin (AM). Scale bar: 5 µm. n>100 cells. (C) Fraction of cells with Gcn3-sfGFP(V206R) filaments during different growth conditions, as quantified from live-cell fluorescence microscopy in a CellASICS microfluidic chamber. Cells grown to log phase in SC medium with 2% glucose (0 min), during ED (20 min and 60 min) and after recovery (80 min) are shown. The arrow indicates duration of ED (red) and recovery (black). Please note that the cells in Fig. 2B and C were grown under different conditions (culture flask versus microfluidic chamber, leading to different values in the fraction assembled). (D) Structured illumination microscopy of Gcn3-sfGFP(V206R) expressing log phase cells during the indicated times of energy depletion. Scale bar: 5 µm. (E) Ultrastructure of eIF2B filaments as found in energy depleted cells by correlative light and electron microscopy (CLEM). Left: electron micrograph of one representative cell overlaid with DAPI signal (blue – fiducials) and GFP signal (green – eIF2B filament). Right: close up of electron dense region corresponding to GFP signal. Scale bar: 1 µm.

