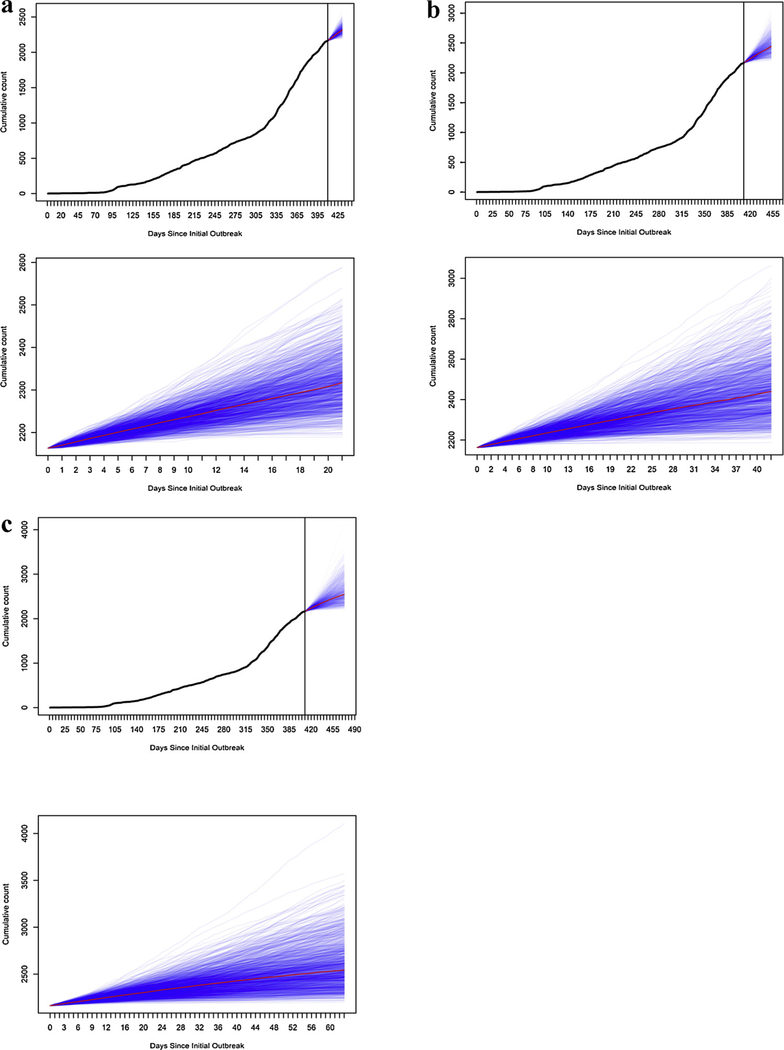
Fig. 3.
Epidemic curve, as of June 16 (cutoff at vertical line), followed by three- (Fig. 3a), six- (Fig. 3b), and nine-week (Fig. 3c) probabilistic projections (blue lines) of case counts, using the Hawkes model (median, red line), both with outbreak history and zoomed-in. (For interpretation of the references to colour in this figure legend, the reader is referred to the web version of this article.)

