Fig. 5.
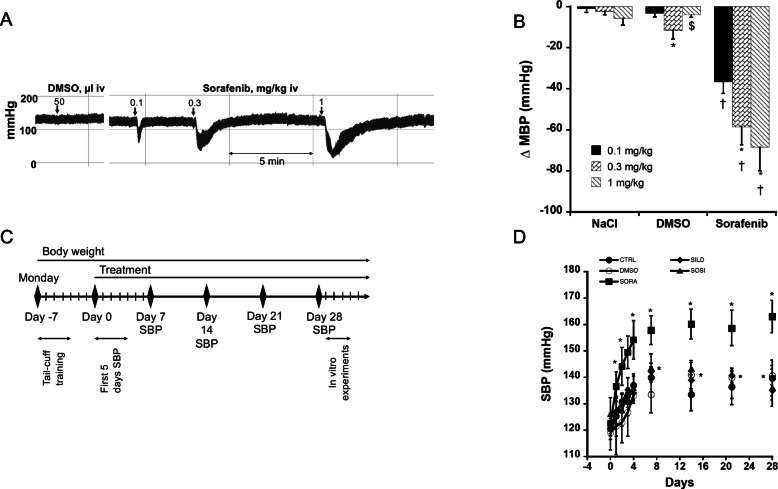
In vivo effects of sorafenib. Panel a: trace recording of blood pressure in anaesthetised rats receiving acute administration of dimethyl sulfoxide (DMSO, 50 μl at 1/1000) or sorafenib. Panel b: Dose-response curve of sorafenib (0.1, 0.3 and 1 mg/kg iv) on mean blood pressure (MBP). Each bar is the mean ± SEM of 6 rats. * P < 0.05; ** P < 0.01 compared to the first dose; †† P < 0.01, ††† P < 0.001 compared to NaCl and DMSO. One factor ANOVA followed by Fisher PLSD. Panel c: protocol for chronic treatments. Panel d: Evolution of systolic blood pressure (SBP) in conscious normotensive rat for 4 weeks treatment with sorafenib. Each point is the mean ± SEM of 4–6 rats. * P < 0.05 compared to Day 0; † P < 0.05 compared to Control

