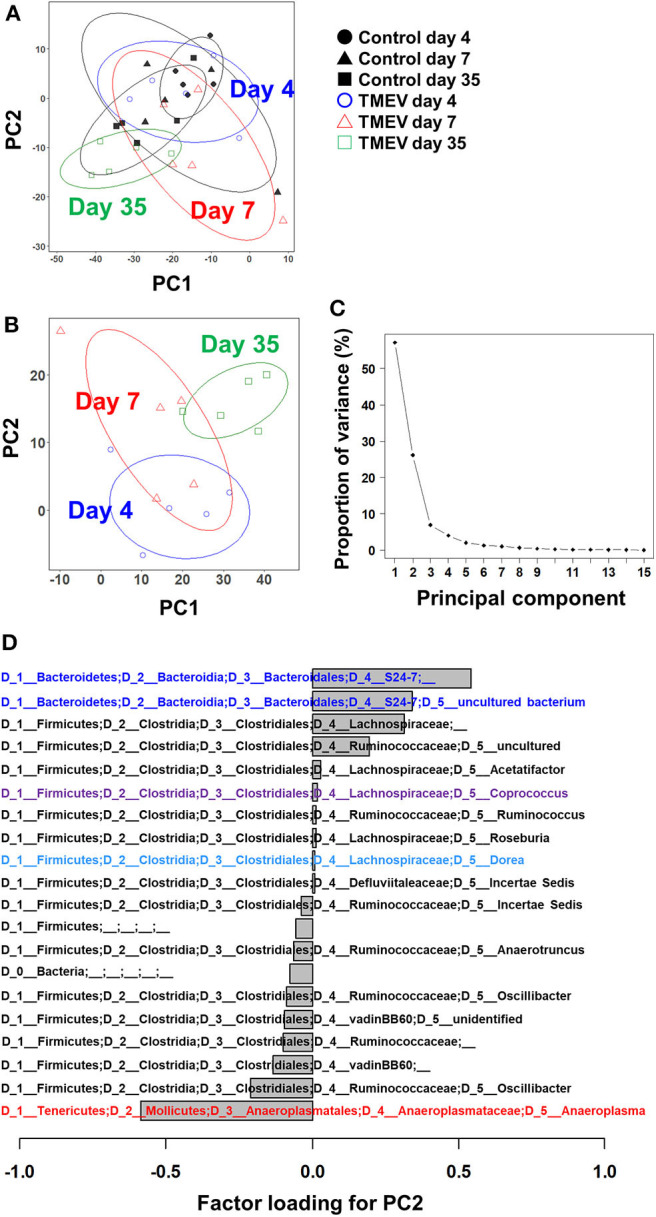
Figure 2.

Principal component analysis (PCA) of fecal microbiome data from the TMEV-infected and control groups. (A) When PCA was conducted using all samples from TMEV-infected and control groups on days 4, 7, and 35, PCA did not separate any sample groups as a distinct population, although TMEV-infected group on day 35 had low principal component (PC) 1 and PC2 values. Ellipses indicated an 80% confidence interval of each group. (B) When PCA was conducted using only samples from TMEV-infected groups, PC2 values increased over the time course from day 4 to day 35. (C) Proportion of variance showed that PC1 and PC2 explained 56 and 25% of variance among the samples, respectively. (D) Factor loading showed the correlations between relative abundance of each bacterial taxon to PC2 values. Increased bacteria belong to the family S24-7 and decreased bacteria belong to the genus Anaeroplasma correlated with PC2 values. We conducted PCA of fecal sample data (n = 5 per group at each time point), using an R function “prcomp.” Graphs with ellipses were drawn, using R packages “dplyr” and “ggplot2”.
